CRO Glossary
Margin of Error
What is the Margin of Error?
The margin of error is a statistical measure that quantifies the uncertainty or potential variation in survey or experiment results. It defines the range within which the true population value is likely to fall, given a specific sample size and confidence level. A smaller margin of error indicates greater precision, while a larger one suggests higher variability in the data.
In A/B testing, market research, and analytics, understanding the margin of error is essential for accurate result interpretation. It enables marketers and data analysts to assess the reliability of their findings, ensuring that business decisions are based on statistically sound insights rather than random fluctuations.
Formula and Calculation
To calculate the margin of error in A/B testing, we use a formula that considers the sample size, standard deviation, and Z-score based on the desired confidence level. The formula for calculating the margin of error is:
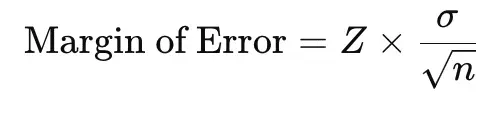
Where:
- Z is the Z-score associated with the chosen confidence level (1.96 for 95%, 2.58 for 99%),
- σ is the standard deviation of the sample,
- n is the sample size.
For example, if you run an A/B test and find a conversion rate increase of 5% with a margin of error of ±2%, this means the true conversion rate increase likely falls between 3% and 7%. This calculation helps determine the reliability of the observed results by providing a range of potential outcomes.
How to Interpret the Margin of Error
Interpreting the margin of error is essential for drawing meaningful conclusions from your results. It indicates the range within which the true effect of the change (e.g., a new design or feature) is likely to fall, given the sample data.
Steps for Interpreting ME:
- Consider the Effect Size Relative to the Margin of Error If the observed effect size is small compared to the margin of error, the results are likely not statistically significant. For example, if the effect size is a 3% increase in conversions, and the margin of error is ±4%, the true effect could range from a 1% decrease to a 7% increase, making the results inconclusive. Conversely, if the effect size is much larger than the margin of error, the results are more reliable.
- Examine the Confidence Interval The margin of error helps construct the confidence interval, which shows the likely range of the true effect. A small ME results in a narrow confidence interval, increasing the precision of the results. A wide ME leads to a broader confidence interval, suggesting less precision. For example, if your test showed a 10% increase in conversions with a ±2% margin of error, you can be confident the true effect lies between 8% and 12%.
- Assess for Practical Significance Even if the results are statistically significant (the effect is outside the margin of error), they should also be practically significant. For example, a statistically significant 0.5% increase in conversions may not be impactful enough to justify changes. The margin of error can help you decide if the range of outcomes justifies implementing the change.
- Use for Decision-Making Companies can use the margin of error to decide whether the observed effect size warrants action. If the range within the margin of error includes both positive and negative outcomes, it may be wise to either increase the sample size, rerun the test, or try a new variation to get more conclusive results.
- Evaluate in Context with Sample Size and Confidence Level A smaller sample size and higher confidence level will result in a larger margin of error, reducing the result’s precision. Interpreting the margin of error in light of these factors can help adjust expectations and determine if additional data or a lower confidence level is needed for decision-making.
Interpretation Example
Suppose you conduct an A/B test, and the results indicate a 6% increase in conversions with a margin of error of ±3% at a 95% confidence level. This result means you can be 95% confident that the true conversion increase falls between 3% and 9%. If a 3% increase is sufficient to justify the change, you might consider it successful. However, if the goal was a 5% minimum increase, the test might need adjustment or further data to ensure reliable results.
In summary, interpreting the margin of error in A/B testing helps teams evaluate the precision and reliability of their results. By understanding the range it provides, you can make more informed, data-driven decisions and understand the confidence you can have in the results before implementing changes.
How to Reduce the Margin of Error
Reducing the margin of error is critical when you want to gain greater confidence in your test results. Here are effective strategies:
- Increase Sample Size: A larger sample size reduces the ME by increasing the precision of the estimate.
- Decrease Variability: Minimize the standard deviation by designing tests with more controlled variables, helping reduce result variability.
- Select a Lower Confidence Level: Although less commonly recommended, reducing the confidence level (e.g., from 99% to 95%) will reduce the Z-score and thus the margin of error.
- Run Tests Over a Longer Duration: Extending the test duration can provide more representative samples, reducing fluctuations in test results.
Optimizing the margin of error enables decision-makers to interpret results with increased accuracy, making it easier to implement changes with confidence.
Standard Error vs. Margin of Error
While closely related, standard error and margin of error are distinct concepts:
- Standard Error measures the variability of the sample mean compared to the population mean. It tells you how much your sample’s results fluctuate.
- Margin of Error extends this by adding the confidence level into the calculation, providing an interval around the sample mean within which the true population mean likely lies.
Essentially, the margin of error incorporates the standard error but includes adjustments for the desired confidence level, giving it a more practical application for interpreting A/B testing results.
Confidence Interval vs. Margin of Error
Another common point of confusion is the difference between a confidence interval and the margin of error:
- Confidence Interval is a range derived from the sample data, within which we expect the true population parameter to lie. For instance, a 95% confidence interval means that if the test were repeated, 95% of the time, the results would fall within this range.
- Margin of Error is half of the confidence interval range. It represents the maximum expected difference between the sample estimate and the true population parameter.
In A/B testing, we often report the confidence interval with the margin of error to give a complete picture of the reliability and variability of the test results.
Calculating Margin of Error Without Standard Deviation
In some cases, you may not have access to the standard deviation. Instead, you can use an estimated proportion if your test involves categorical data. For proportions, the margin of error formula is:
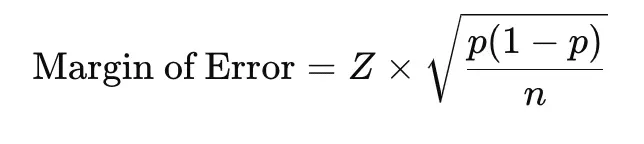
Where:
- p is the observed proportion,
- n is the sample size.
This formula provides a reasonable estimate for categorical outcomes, like conversion rates in an A/B test.
Why ME is Crucial in A/B Testing
In A/B testing, the margin of error serves as a statistical safeguard that ensures observed differences aren’t due to random chance. By understanding this metric, companies can avoid making erroneous decisions that may lead to negative impacts, such as launching ineffective changes based on misleading test results.
It also helps determine the significance of test results. For example, if the effect size of an A/B test is smaller than the margin of error, then the results are inconclusive, and further testing or a larger sample size may be necessary.
FAQs
What is an acceptable margin of error?
An acceptable ME generally falls between 1% and 5%, depending on the context of the test. For high-stakes business decisions, a smaller margin of error (1-2%) is often preferred. For exploratory tests, a slightly higher margin of error may be acceptable.
What is the margin of error for a 95% confidence interval?
The margin of error for a 95% confidence interval is calculated by multiplying the standard error by the Z-score of 1.96. This Z-score reflects the 95% confidence level, meaning there’s a 5% chance the true effect size lies outside the interval.
Can the ME be negative?
No, the margin of error is always positive. It represents the range around an estimate, providing an absolute value for the potential variance.
Theory is nice, data is better.
Don't just read about A/B testing, try it. Omniconvert Explore offers free A/B tests for 50,000 website visitors giving you a risk-free way to experiment with real traffic.


AI-Powered CRO
Audit for eCommerce
Find your biggest conversion leaks in 15 minutes.
Benchmark UX, accessibility, and data hygiene then unlock tailored A/B testing ideas.
Unlock my CRO score

Sign up to our bi-monthly newsletter!
Actionable eCommerce insights only.

Master what matters most in eCommerce
✅ Get more loyal customers
✅ Improve Customer Lifetime Value
✅ Maximize profits
Discover all features30-day free trial, no credit card necessary.