CRO Glossary
Conjoint Analysis
What is Conjoint Analysis?
Conjoint analysis is a quantitative research method used to assess how consumers prioritize different product or service attributes when making purchasing decisions. By systematically breaking down choices into individual components, this technique helps businesses determine which features hold the most value for customers and how they influence overall preference. It is widely employed in market research, product development, and pricing strategies, allowing companies to optimize offerings based on real consumer trade-offs rather than assumptions.
For example, when designing a new smartphone, a company can use conjoint analysis to evaluate whether customers prioritize battery life, camera quality, or price. By analyzing these preferences, businesses gain data-driven insights that guide product positioning, competitive differentiation, and pricing models, ensuring they meet consumer expectations and maximize market appeal.
Importance of Conjoint Analysis in Business
In a competitive market, understanding customer preferences is vital. Conjoint analysis enables businesses to:
- Prioritize Product Features: Focus resources on developing features that customers truly value.
- Optimize Pricing Strategies: Determine willingness to pay for various configurations.
- Segment Markets: Identify diverse customer groups based on preference patterns.
- Improve Customer Satisfaction: Create offerings that resonate with target audiences.
Key Terms
- Attributes: Characteristics or features of a product (e.g., color, size, or price).
- Levels: Specific options for each attribute (e.g., red, blue, green for the attribute “color”).
- Features: The combination of attributes and levels that define a product.
History of Conjoint Analysis
Conjoint analysis was first introduced in the 1960s by mathematical psychologists Luce and Tukey, who laid the theoretical foundation for the method in their seminal paper on conjoint measurement. Initially conceptualized to measure subjective preferences, it found its first applications in psychology for studying decision-making processes.
In the 1970s, market researchers adapted conjoint analysis to understand consumer preferences, marking its entry into the business world. Harvard Business School played a pivotal role in popularizing the method through applied research and case studies.
The 1980s and 1990s saw the advent of computer-based conjoint analysis, making it easier to handle complex datasets and analyze customer preferences at scale. Techniques such as choice-based conjoint (CBC) and adaptive conjoint analysis (ACA) were developed during this time, offering more realistic and dynamic ways to study decision-making.
With advancements in technology, the 2000s brought online conjoint surveys, enabling researchers to reach larger and more diverse populations efficiently. Today, tools like Conjointly and Qualtrics simplify the design and analysis process, democratizing access to conjoint analysis for businesses of all sizes.
The method has since evolved to include hierarchical Bayesian models and machine learning, which enhance precision in interpreting results. Conjoint analysis remains a cornerstone of market research, aiding industries ranging from technology to healthcare in creating customer-centric strategies.
How Does Conjoint Analysis Work?
Conjoint analysis works by simulating real-world decision-making scenarios to uncover the preferences and trade-offs that consumers make when choosing between different product or service configurations. The method relies on structured questionnaires where respondents evaluate product bundles that vary systematically in terms of attributes and levels.
Respondents are typically shown a series of choice sets, each containing multiple options. For example, they might be asked to choose between three different smartphone models, each varying in price, battery life, camera quality, and brand. By selecting the option they prefer most in each set, respondents reveal which attributes are more important and how they interact in their decision-making process.
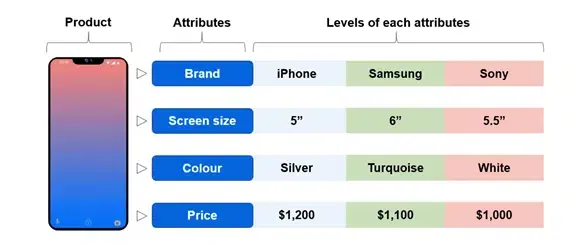
Image source: Baremetrics
The structured nature of conjoint analysis ensures that the data collected is actionable. Each choice made by a respondent reflects realistic trade-offs, providing insight into consumer behavior that mirrors everyday purchasing decisions. Advanced algorithms model and predict consumer preferences, enabling businesses to estimate market share for specific product configurations and identify combinations that maximize appeal.
Conjoint analysis is often conducted through online surveys, which allow for diverse participant groups and faster data collection. Once responses are collected, the data is analyzed to determine the relative importance of attributes and the utility value of specific levels within those attributes. These insights guide product design, pricing strategies, and marketing efforts.
Example: A Conjoint Analysis in Action
Let’s take the case of a coffee machine manufacturer exploring new product options. The company identifies four key attributes for its coffee machines: price, brewing speed, capacity, and design. Each attribute has several levels. For instance:
- Price: $100, $150, $200
- Brewing Speed: 2 minutes, 5 minutes, 8 minutes
- Capacity: 4 cups, 8 cups, 12 cups
- Design: Classic, Modern
In the conjoint survey, respondents are presented with choice sets like this:
- Option A: $100, brews in 2 minutes, 4-cup capacity, Classic design
- Option B: $150, brews in 5 minutes, 8-cup capacity, Modern design
- Option C: $200, brews in 8 minutes, 12-cup capacity, Classic design
The respondent selects the option they would most likely buy. By analyzing these selections across many participants, the company can determine:
- Which attributes (e.g., price vs. capacity) influence buying decisions the most?
- The ideal combination of features to maximize customer satisfaction.
- The trade-offs customers are willing to make, such as paying more for faster brewing speeds.
These findings allow the company to tailor its offerings to meet market demand while optimizing production costs.
When Use Conjoint Analysis?
Conjoint analysis is most valuable in scenarios where understanding customer preferences, trade-offs, and decision-making processes is critical for making informed business decisions. This powerful tools helps businesses design, price, and position products or services in a way that aligns with market demands. By simulating real-world choices, conjoint analysis provides actionable insights into the factors driving customer behavior and allows organizations to prioritize features or attributes that matter most.
This method is particularly useful when businesses need to evaluate the importance of multiple attributes, assess pricing strategies, or predict how customers will respond to new product configurations. By uncovering customer priorities and trade-offs, conjoint analysis supports strategic decisions across industries.
Examples of When to Use it:
- Product Development: When launching a new product or improving an existing one, conjoint analysis can help identify which features or combinations of features are most appealing to customers.
- Pricing Strategy: Businesses can determine the optimal price point for their products or services by analyzing how price influences customer decisions.
- Market Segmentation: Conjoint analysis helps in understanding different customer segments and tailoring products or services to meet the unique preferences of each group.
- Employee Benefits Packages: Designing cost-effective benefits packages that satisfy employee needs can be supported by conjoint analysis.
It Can Also Help Answer Business Questions Such As:
- What feature or functionality of a product is most important and influential to the market?
- What do customers focus on when making purchase decisions?
- What has the greatest impact on whether customers will purchase or not?
- Are customers willing to sacrifice X to have Y?
- What role does price play in decision-making, and what is the optimal price point?
- How sensitive will customers be to shifts in pricing?
- What is the monetary value of the different product attributes?
- How can we create a benefits package that our employees want and that is still cost-effective for the business?
- What do optimal pricing and packaging look like for a software platform to address different types of buyers and maximize revenue?
Why Use Conjoint Analysis?
Conjoint analysis is a vital tool for businesses seeking to gain deeper insights into customer preferences and behavior. Unlike other research methods, it focuses on how customers make trade-offs when evaluating different product or service options, mimicking real-world decision-making processes. This makes conjoint analysis uniquely suited for addressing complex, multi-faceted questions about product design, pricing, and market segmentation.
The key reason to use conjoint analysis lies in its ability to uncover the “why” behind customer choices. It helps businesses understand not just what customers prefer but also the relative importance of various attributes in shaping those preferences. By quantifying these trade-offs, organizations can prioritize features, adjust pricing strategies, and optimize market positioning with data-driven confidence.
Types of Conjoint Analysis
1. Discrete Choice-Based Conjoint (CBC) Analysis
This is the most commonly used type of conjoint analysis. Respondents are presented with sets of product or service options (called choice sets) and asked to choose their preferred one. Each option consists of different combinations of attributes and levels. The goal is to simulate a real-world decision-making process.
Example: A car manufacturer might use CBC to test different configurations for a new model. Respondents could choose between options with varying attributes, such as engine type (electric, hybrid, or gas), features (autonomous driving, heated seats), and price points. This data helps identify the most popular configurations and acceptable price ranges.
Strengths:
- Closely mimics real-world scenarios.
- Can handle complex designs with multiple attributes.
Best For: Pricing studies, product launches, and competitive positioning.
2. Adaptive Conjoint Analysis (ACA)
This approach is designed to handle a large number of attributes. It adapts in real-time based on the respondent’s previous answers, focusing on the most relevant trade-offs for each individual.
Example: A software company designing an enterprise platform might ask participants to rank the importance of features like data security, cloud storage, and integrations. Based on their responses, subsequent questions focus on fine-tuning preferences between these high-priority attributes.
Strengths:
- Efficient for studies with many attributes.
- Provides personalized insights into preferences.
Best For: Niche markets, highly customizable products, and scenarios with extensive attribute lists.
3. Full-Profile Conjoint Analysis
Respondents evaluate full product profiles rather than specific attributes. These profiles include all possible combinations of attributes, which ensures that trade-offs between all variables are considered.
Example: A hospitality chain could use full-profile conjoint analysis to test room preferences. Profiles might include attributes such as room size, view type, breakfast inclusion, and price. Respondents rank or rate these complete profiles, providing insights into which combinations resonate most.
Strengths:
- Comprehensive and detailed.
- Captures interaction effects between attributes.
Best For: Testing holistic product offerings or complete service packages.
4. MaxDiff Conjoint Analysis
Also called Best-Worst Scaling, this method asks respondents to select the most and least preferred options from a set of attributes. It’s particularly useful for understanding the relative importance of a large number of features.
Example: An e-commerce platform might use MaxDiff to identify which site features customers value most, such as free shipping, fast delivery, or extensive product reviews. Respondents indicate their top and bottom priorities from a given set.
Strengths:
- Simplifies comparison among many attributes.
- Provides clear prioritization.
Best For: Feature prioritization, customer value assessments, and marketing strategies.
5. Hybrid Conjoint Analysis
This combines elements from multiple types of conjoint analysis, such as CBC and ACA, to maximize flexibility and adapt to unique research needs.
Example: A telecommunications company might use hybrid conjoint analysis to study both feature trade-offs (CBC) and personalized attribute importance (ACA). This approach balances precision with scalability.
Strengths:
- Versatile and customizable.
- Combines the strengths of multiple methods.
Best For: Complex studies need a mix of quantitative and qualitative insights.
How to Conduct a Conjoint Analysis
Conducting a conjoint analysis involves several structured steps that allow researchers to simulate consumer decision-making and derive actionable insights. Here’s a detailed explanation of each stage:
1. Configure Conjoint
Describe Your Experiment:
Define the problem or goal of your analysis. For instance, are you looking to optimize product pricing, identify key features, or predict market share? Clarity in your objectives ensures that the study is focused and actionable.
Example: A smartphone manufacturer wants to understand which features—battery life, camera quality, storage capacity, or price—drive consumer preferences.
Specify Attributes:
Attributes are the key features or dimensions of the product or service being studied. Select attributes that are relevant to customer decision-making and align with your research objectives.
Example Attributes for a Car:
- Engine type (electric, hybrid, gas)
- Exterior color (red, blue, black)
- Price ($20,000, $25,000, $30,000)
Specify Levels for Attributes:
Each attribute has levels that represent its possible variations. Keep the number of levels manageable to avoid overwhelming respondents.
Example Levels for Engine Type:
- Electric
- Hybrid
- Gasoline
Determine Participants:
Choose a representative sample of your target audience. Ensure the respondents are potential buyers or users of the product, as this increases the validity of the results.
2. Review Survey
Create a mock version of your conjoint survey and test it internally. This step ensures the questions and choice sets are clear, and no critical attributes are overlooked. Feedback from initial testers can prevent confusion later on.
3. Distribute Survey
Distribute your conjoint survey using methods that reach your target audience effectively. Common channels include:
- Email: Send personalized invitations to existing customers or research participants.
- Social Media: Share surveys on platforms like LinkedIn or Facebook for broader reach.
- Anonymous Survey Links: Share links in newsletters or embed them in websites for public participation.
Ensure the platform you use allows you to track responses and completion rates effectively.
4. Analyze Results
Once the survey is completed, analyze the responses to extract meaningful insights:
- Use statistical software or dedicated conjoint tools like Conjointly or Sawtooth Software.
- Model how various combinations of attributes affect consumer preferences.
- Simulate market scenarios, such as predicting the popularity of a new product configuration.
Let’s explore how to interpret results in the next section.
Interpreting Results in Conjoint Analysis
Interpreting conjoint analysis results provides a comprehensive understanding of consumer preferences. Below are the key elements to focus on:
1. Relative Importance by Attribute
Calculate how much each attribute contributes to the decision-making process. This helps prioritize features that are most influential to customers.
Example for a smartphone:
- Price (40% importance)
- Battery Life (30%)
- Camera Quality (20%)
- Storage Capacity (10%)
2. Relative Value by Level
Assess the utility (or part-worth) of each level within an attribute. This shows how much consumers value specific attribute levels.
Example for Camera Quality:
- 12 MP Camera = 5 utility points
- 24 MP Camera = 15 utility points
- 48 MP Camera = 30 utility points
3. Distribution of Preferences for Levels
Analyze the percentage of respondents who prefer each level of an attribute. This identifies clear preferences and patterns among consumers.
Example for Storage Capacity:
- 64 GB: Preferred by 20%
- 128 GB: Preferred by 50%
- 256 GB: Preferred by 30%
4. Distribution of Most Preferred Levels
Identify the most preferred levels within each attribute across respondents. This provides actionable data for designing products.
Example for Car Paint Color:
- Black: 60% preference
- Red: 25% preference
- Blue: 15% preference
5. Ranked List of Product Concepts
Rank the overall product configurations (combinations of attributes and levels) to identify the most preferred or optimal concept.
Example: For an e-bike, the highest-ranked product concept might combine:
- Motor Type: Brushless
- Range: 50 miles
- Price: $1,000
6. Distribution of Preferences for Brands
If brand perception is included as an attribute, analyze how much influence it has on consumer choices.
Example for Soft Drinks:
- Brand A: Preferred by 40%
- Brand B: Preferred by 35%
- Brand C: Preferred by 25%
Tools to Conduct a Conjoint Analysis
Conducting conjoint analysis is more efficient and accurate with the right tools. Below are three notable platforms that can help streamline the process:
- Conjointly A popular platform that offers comprehensive tools for designing, conducting, and analyzing conjoint studies. It is beginner-friendly and supports various types of conjoint analysis, including choice-based and MaxDiff methods. Best for: Businesses looking for an all-in-one solution to quickly generate actionable insights.
- Sawtooth Software Widely used in academic and business settings, Sawtooth Software provides advanced features for choice-based and adaptive conjoint studies. It also includes options for large-scale customization and complex analysis. Best for: Researchers or teams with technical expertise who need advanced customization.
- SurveyMonkey with Conjoint Add-ons SurveyMonkey integrates conjoint features, allowing for easy survey distribution and analysis. It simplifies the process for teams already familiar with SurveyMonkey’s core platform. Best for: Companies seeking an intuitive way to incorporate conjoint analysis into existing survey workflows.
Common Pitfalls and How to Avoid Them
Conjoint analysis is powerful but can encounter challenges if not conducted carefully. Below are common pitfalls and strategies to avoid them:
1. Too Many Attributes or Levels
Problem: Presenting respondents with too many attributes or levels can lead to cognitive overload, reducing the quality of responses. Solution: Limit the study to 5-7 attributes and ensure each attribute has a manageable number of levels. Test the survey internally to confirm it’s easy to understand and complete.
2. Irrelevant or Redundant Attributes
Problem: Including attributes that don’t significantly impact consumer decisions leads to irrelevant data. Solution: Conduct preliminary research, such as focus groups, to identify attributes that truly matter to your target audience.
3. Small Sample Size
Problem: A sample size that is too small limits the reliability of the findings, making it hard to generalize results. Solution: Ensure a sufficiently large and diverse sample, typically at least 200-300 respondents, depending on the complexity of the study.
4. Biased or Leading Questions
Problem: Poorly phrased questions can skew responses, reducing the objectivity of the data. Solution: Use neutral language and structured choice sets. Avoid framing questions in ways that guide respondents toward certain answers.
5. Ignoring Statistical Significance
Problem: Focusing only on the descriptive results without considering statistical rigor may lead to misleading conclusions. Solution: Use statistical tools and software to validate results, ensuring they hold significance across different demographics or market segments.
6. Improper Survey Distribution
Problem: Distributing the survey through inappropriate channels can result in poor response rates or unrepresentative data. Solution: Use channels that align with where your target audience is most active, such as email for B2B audiences or social media for broader consumer markets.
A Great Analysis Technique
Developing compelling products and services hinges on predictive data that simulates real-world decision-making. Conjoint analysis bridges this gap by helping businesses understand what customers value most in product features, pricing, and configurations.
In the past, acquiring such insights required advanced technical knowledge and cumbersome tools, but today’s platforms make it accessible to businesses of all sizes. By leveraging conjoint analysis, you can make informed decisions about product development, pricing strategies, and marketing campaigns, ultimately maximizing customer satisfaction and driving business growth.
Theory is nice, data is better.
Don't just read about A/B testing, try it. Omniconvert Explore offers free A/B tests for 50,000 website visitors giving you a risk-free way to experiment with real traffic.


AI-Powered CRO
Audit for eCommerce
Find your biggest conversion leaks in 15 minutes.
Benchmark UX, accessibility, and data hygiene then unlock tailored A/B testing ideas.
Unlock my CRO score

Sign up to our bi-monthly newsletter!
Actionable eCommerce insights only.

Master what matters most in eCommerce
✅ Get more loyal customers
✅ Improve Customer Lifetime Value
✅ Maximize profits
Discover all features30-day free trial, no credit card necessary.