CRO Glossary
Analysis of Variance (ANOVA) in Marketing Research
What is ANOVA?
Analysis of Variance (ANOVA) is a statistical technique that helps marketers and businesses determine whether differences between multiple groups are statistically significant or merely due to chance. In marketing research, ANOVA is particularly useful for assessing the impact of various strategies, customer segments, or campaign variations on key performance metrics. By analyzing how different independent variables influence outcomes, businesses can identify which factors truly drive performance and optimize their strategies accordingly.
For example, a company testing three different ad creatives across multiple audience segments can use ANOVA to determine whether variations in engagement or conversion rates are meaningful. This method ensures that marketing decisions are backed by data-driven insights, reducing reliance on assumptions and improving overall campaign effectiveness.
The Role of ANOVA in Data-Driven Decision-Making
Relying only on assumptions can be risky. This is where ANOVA becomes essential, as it allows businesses to validate their marketing efforts with concrete data. Whether it’s comparing the performance of different ad creatives or assessing customer satisfaction levels across various segments, ANOVA provides actionable insights to improve marketing strategies.

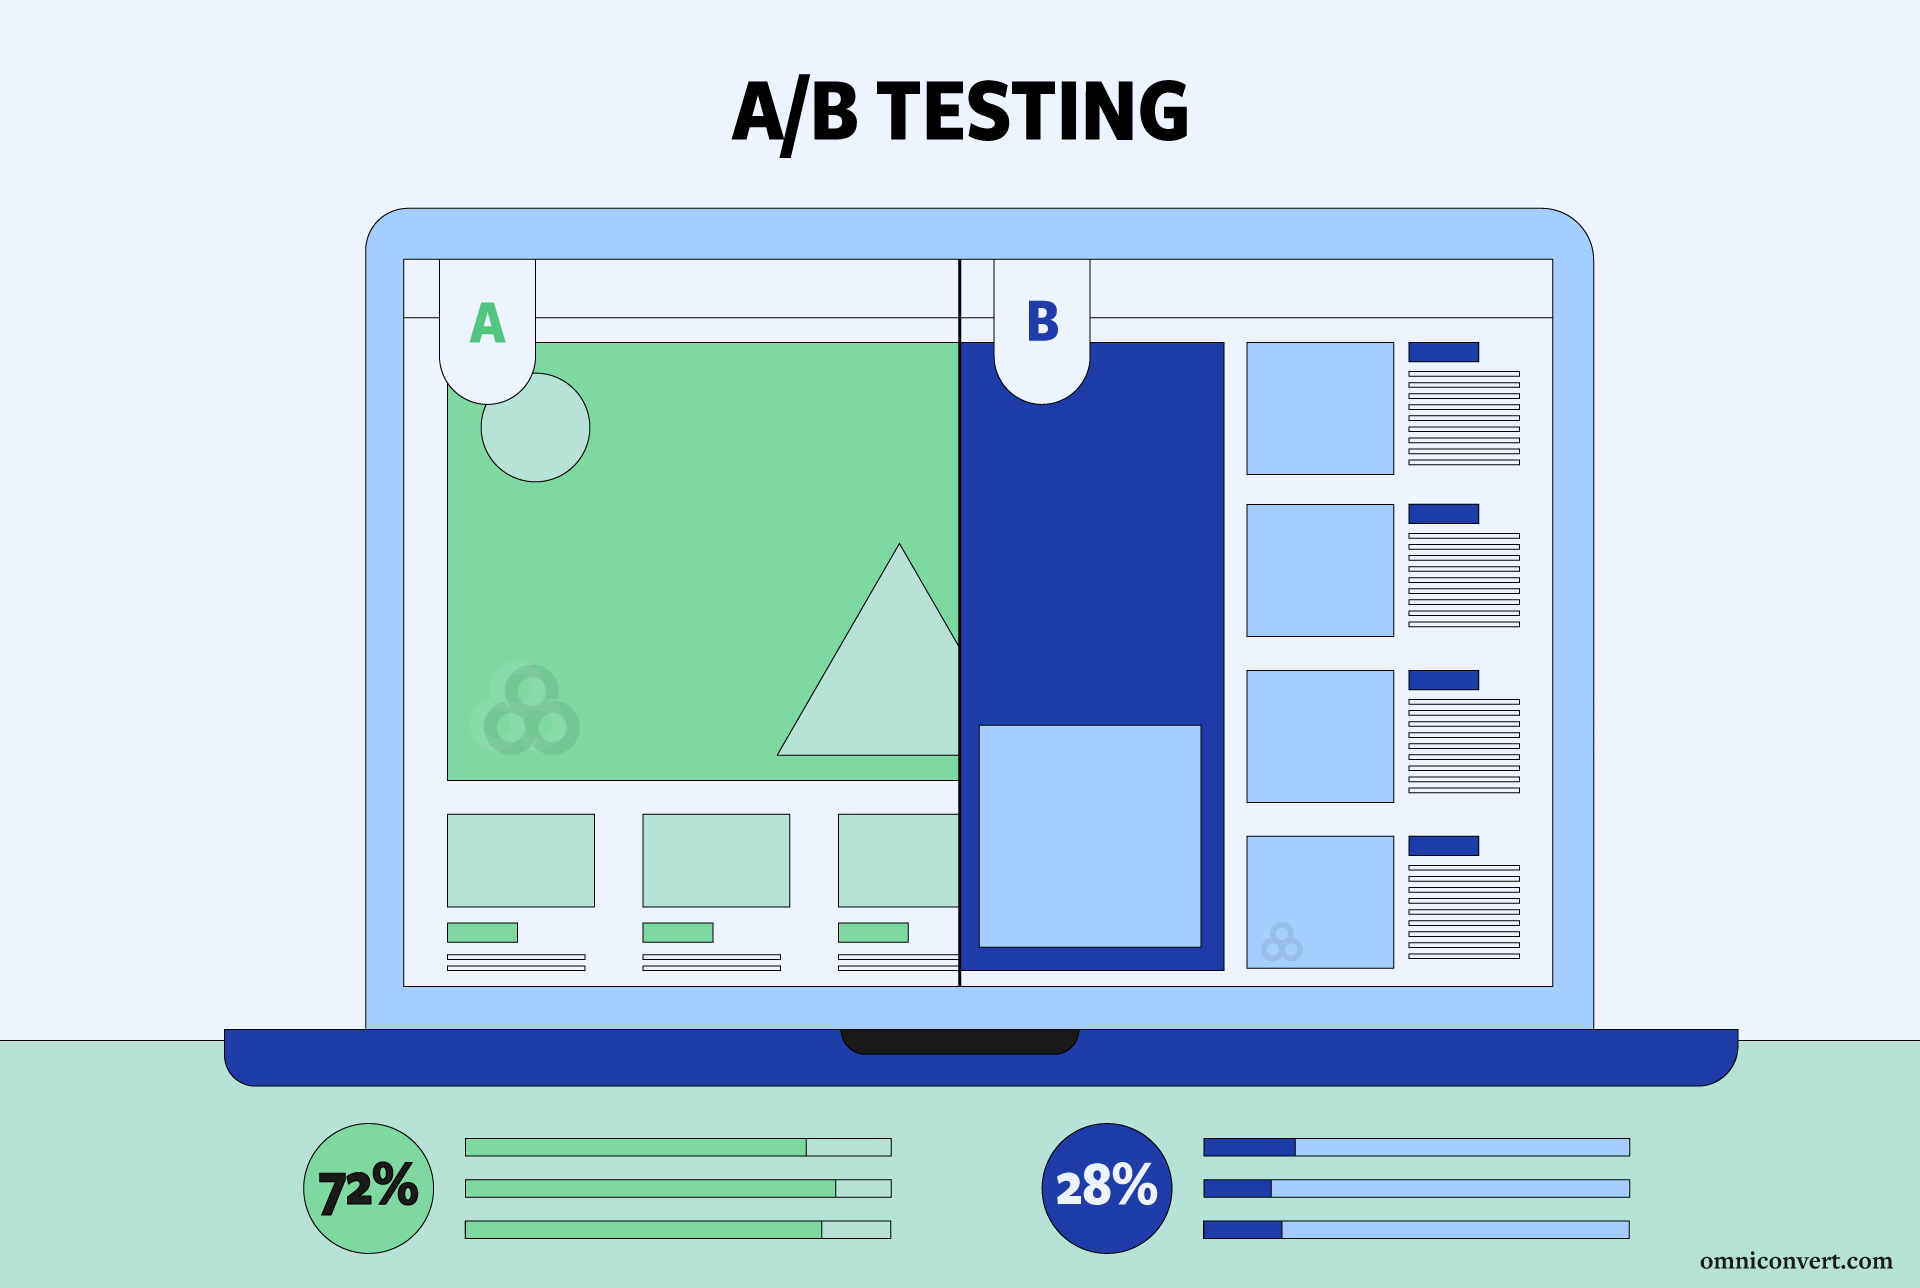
How ANOVA Enhances A/B Testing and Marketing Surveys
ANOVA plays a crucial role in optimizing A/B testing and marketing surveys. While A/B testing often involves comparing just two groups, ANOVA extends this capability by analyzing multiple groups or variations at once. This deeper analysis helps businesses evaluate various strategies and fine-tune marketing efforts to maximize their impact.
Understanding the Basics of ANOVA
Key Concepts and Terminology in ANOVA
ANOVA tests whether there are statistically significant differences between the means of three or more groups. These are some of the key concepts that you need to know while conducting this analysis:
- Null hypothesis: Assumes no difference exists between groups.
- Alternative hypothesis: Proposes that there is a significant difference between at least two of the groups.
- F-statistic: The ratio of variance between groups to variance within groups. A larger F-statistic indicates greater differences between groups.
- P-value: Used to determine the statistical significance of the results. A p-value less than 0.05 typically indicates that the differences between groups are statistically significant.
The Importance of Variance Analysis in Marketing Research
In marketing, understanding variance—the degree to which data points differ from each other— can indicate whether a strategy is performing consistently or if there are outliers that need to be addressed. Analyzing variance allows marketers to evaluate different campaigns, customer behaviors, or product features to see which ones are driving meaningful differences in performance.
For example, if a SaaS company is running a promotion to different customer segments—enterprise clients, small businesses, and individual users. The company wants to understand if there’s a significant difference in how these segments respond to the promotion. By using ANOVA, they analyze the variance in conversion rates across these groups and adjust the strategies and budget to those once with better performance.
Hypothesis Testing in Business Decisions
ANOVA is rooted in hypothesis testing, which helps determine if a marketing strategy, product feature, or customer segment has a meaningful impact on outcomes. By testing hypotheses, you can make decisions based on data rather than intuition, leading to more effective strategies and higher ROI.
Types of ANOVA Relevant to Business and Marketing
There are different approaches to using ANOVA for your data analysis. Here are some of the most common ones:
One-Way ANOVA
One-way ANOVA is used when comparing the means of three or more groups based on a single independent variable. In marketing, this type of analysis is valuable when you want to evaluate the impact of a single factor across multiple groups.
Example: Suppose a company is testing three different pricing strategies for its product (e.g., discount pricing, premium pricing, and standard pricing) and wants to know if one strategy drives higher sales than the others. A one-way ANOVA would help determine whether the differences in sales across these three pricing strategies are statistically significant, allowing the company to choose the most effective pricing model.
Two-Way ANOVA
Two-way ANOVA is used when studying the impact of two independent variables on a dependent variable, which is particularly useful when exploring the interaction between different marketing strategies.
Example: A marketing team at a B2B company is interested in evaluating the combined effect of two factors—email subject line and sending time—on open rates. By running a two-way ANOVA, the team can not only assess the individual effects of a subject line and sending time but also determine if there’s any interaction between the two (e.g. if certain subject lines perform better at specific times of the day). This insight allows the team to fine-tune both their messaging and timing for optimal results.
Repeated Measures ANOVA
Repeated measures ANOVA is used when the same subjects are measured multiple times under different conditions. In marketing, this is especially valuable for tracking changes over time, such as customer satisfaction or product usage.
Example: An e-commerce company wants to track customer satisfaction before and after implementing a new website feature. Using repeated measures ANOVA, the company can assess whether satisfaction scores significantly improve after the new feature is launched and whether the improvement holds steady over time. This method allows the business to measure the direct impact of its interventions on customer experience.
Assumptions of ANOVA in Marketing Research
The assumptions are crucial to ensure that ANOVA results are meaningful, since in marketing research, the data might come from various sources or have unique characteristics. If these assumptions are violated, the reliability of the results could be compromised. Here are the key assumptions of ANOVA:
Independence
The data points in each group must be independent of one another. This means that the performance of one individual or group should not influence the performance of another. In marketing research, this could translate to ensuring that responses from customers in different segments (e.g., geographical regions or demographic groups) do not influence each other.
Example: An e-commerce company surveying customer satisfaction must ensure that each respondent is answering independently. If, for example, customers are influenced by peers or by marketing communication targeted at another group, the independence assumption might be violated.
Normality
ANOVA assumes that the data within each group follows a normal distribution. This is especially important when analyzing small sample sizes. In large datasets, slight deviations from normality might not have a significant impact, but in smaller datasets, this assumption becomes critical.
Example: A SaaS company analyzing product usage data from different customer segments needs to check whether the distribution of data (e.g., number of logins per day) is approximately normal in each segment. If one segment has a highly skewed distribution, corrective measures, such as transforming the data, might be needed before applying ANOVA.
Homogeneity of Variances
The variance within each group should be roughly equal. This is known as the assumption of homoscedasticity. If the variance differs significantly between groups, the results of ANOVA could be misleading.
Example: If a B2B marketing team is running an A/B test comparing the effectiveness of different email campaigns, they need to ensure that the variation in open rates between the two groups (e.g., group A receiving campaign 1 and group B receiving campaign 2) is similar. Large discrepancies in variance can distort the analysis and lead to incorrect conclusions.
Strategies for Dealing with Assumption Violations
In real-world marketing data, these assumptions are not always perfectly met. However, there are strategies marketers can employ to address these violations and still conduct a reliable ANOVA:
- Data Transformation: If the data are not normally distributed, applying transformations like logarithmic or square root transformations can help meet the normality assumption.
- Using Robust Tests: When variances are unequal, marketers can use alternative tests such as the Welch ANOVA, which does not assume equal variances.
- Bootstrap Methods: Resampling techniques like bootstrapping can also be used to create more accurate estimates without strict adherence to traditional ANOVA assumptions.
Implementing ANOVA in Business and Marketing Studies
When it comes to implementing ANOVA in business and marketing studies, marketers need to follow a structured approach to ensure they draw meaningful conclusions from their data. From preparing the data to selecting the right test, each step is crucial to a successful analysis.
Preparing Marketing Data for ANOVA
Before conducting an ANOVA, it’s essential to prepare and clean the marketing data. This includes removing outliers, handling missing data, and ensuring that the variables align with the assumptions of the test.
Example: If a SaaS company is running an A/B test comparing user engagement across different subscription tiers, they must first ensure that any outliers—such as users who sign up but never engage—are removed from the analysis. Additionally, missing data from incomplete user profiles should be addressed by either imputing the missing values or excluding those cases to avoid skewing the results.
Selecting the Appropriate ANOVA Test for Marketing Research Questions
Selecting the right type of ANOVA depends on the research question and the structure of the data. Here’s a quick recap to help marketers choose the correct ANOVA test:
- One-Way ANOVA: Use this test if you’re comparing the effect of a single factor (e.g., marketing channel) across multiple groups (e.g., different customer segments).
- Two-Way ANOVA: If you want to analyze the impact of two factors (e.g., marketing channel and seasonality) simultaneously, this is the test to use. It also reveals potential interaction effects between the two variables.
- Repeated Measures ANOVA: When evaluating the same subjects multiple times (e.g., customer feedback before and after a product update), a repeated measures ANOVA is most appropriate.
Example: An e-commerce company might want to compare the effect of two different advertising campaigns across three different customer demographics (e.g., age groups). In this case, a two-way ANOVA would allow the company to examine not only the independent effects of each campaign but also how each campaign performs within different demographics.
Utilizing Software Tools for ANOVA Analysis in Marketing Studies
Many software tools can simplify ANOVA calculations for marketers. These tools automate the process, ensuring accurate results while saving time. Common software options include:
- SPSS: Popular in academia and business alike, SPSS provides a user-friendly interface for conducting ANOVA and a wide range of statistical tests.
- R: For more advanced users, R offers extensive packages like aov() for conducting ANOVA. It’s free, flexible, and highly customizable.
- Excel: For simpler applications, Excel’s Data Analysis Toolpak includes a built-in option for conducting one-way ANOVA, making it accessible to marketers with basic statistical needs.
Example: A B2B company analyzing customer churn rates based on various service features might use R to conduct a one-way ANOVA. R provides not only the ANOVA results but also visualizations like boxplots that can help interpret how each feature influences churn.
ANOVA in A/B Testing
When used correctly, ANOVA can enhance the traditional A/B testing process, enabling marketers to analyze multiple variables at once and uncover deeper insights.
The Significance of A/B Testing in Marketing Strategies
A/B testing allows businesses to compare two variations of a campaign, webpage, or product feature and determine which performs better. By isolating a single variable, such as headline copy or button color, companies can make data-backed decisions that improve conversion rates, customer engagement, or other key performance metrics.
However, when there are more than two versions of a variable to compare, traditional A/B testing becomes limited. This is where ANOVA comes in handy, as it allows marketers to analyze multiple groups or variations simultaneously, making it especially useful in complex marketing environments.
Example: Imagine a SaaS company running an A/B/C test on its homepage, where it compares three different pricing page designs. While a standard A/B test would only allow a comparison of two designs at a time, a one-way ANOVA can analyze all three designs at once, helping the company determine the best-performing design with greater efficiency.
How ANOVA Complements Traditional A/B Testing Methods
ANOVA enables marketers to go beyond simple comparisons. It not only tests for differences between group means but also provides insight into how multiple factors interact, offering a more complete picture of what drives performance.
For example, if a B2B company is testing two landing page variations and also wants to examine how the variations perform across different geographic regions, a two-way ANOVA would allow them to see if there’s an interaction effect between the landing page version and the user’s location.
By incorporating ANOVA into A/B testing:
- Marketers can test multiple versions of a single variable (e.g., three different headlines) instead of limiting themselves to just two variations.
- It helps detect interaction effects between multiple factors, such as the combination of marketing channels and geographic location.
- More efficient resource allocation by analyzing several variations at once, reducing the need for numerous A/B tests.
ANOVA for Marketing Surveys
Surveys are essential tools for understanding customer behavior, preferences, and satisfaction levels. When analyzing survey data, particularly when there are multiple groups or variables to compare, ANOVA proves to be a powerful method for drawing actionable insights.
Analyzing Customer Feedback and Preferences with ANOVA
Customer surveys often produce large datasets that contain responses from diverse groups of people. ANOVA allows marketers to compare the results of these different groups and identify significant differences. This is crucial when determining how various customer segments perceive a product, service, or campaign.
For example, an e-commerce company might run a post-purchase survey to assess customer satisfaction across different age groups or geographic regions. With ANOVA, the company can determine if satisfaction levels vary significantly between younger and older customers or between regions.
Identifying Key Factors that Influence Customer Satisfaction and Loyalty
Marketing surveys often aim to uncover what drives customer satisfaction and loyalty. ANOVA helps marketers analyze these driving factors by evaluating how different variables affect customer responses. Whether it’s pricing, product features, or customer service quality, ANOVA allows businesses to pinpoint which elements have the most significant impact on customer behavior.
For instance, a B2B company conducting a customer experience survey might use a two-way ANOVA to explore how both service quality and response time influence overall satisfaction. This analysis would reveal whether there’s a strong interaction between these variables, guiding future improvements.
Example: Using ANOVA to Refine Product Features Based on Customer Surveys
Imagine a software company gathering feedback on three potential new features through a survey. Each feature has varying levels of appeal to different customer segments, such as small businesses versus enterprise clients. By applying a one-way ANOVA, the company can analyze which segment is most excited about which feature, helping them prioritize development efforts.
Alternatively, if the company wanted to explore how feature preference changes based on both the customer’s company size and industry, a two-way ANOVA would reveal if there’s any interaction between these two factors, leading to more informed product development decisions.
Interpreting ANOVA Results in a Marketing Context
Once ANOVA has been conducted, the next crucial step is to interpret the results accurately. Understanding the output can lead to actionable insights that inform marketing strategies and decision-making processes.
Reading the ANOVA Table with a Focus on Marketing Implications
The ANOVA output includes an ANOVA table, which summarizes the variance within and between groups. The key components to focus on are:
- F-Statistic: This value indicates the ratio of variance between groups to variance within groups. A higher F-value suggests that there is a significant difference between group means.
- P-value: This value helps determine statistical significance. A p-value less than the chosen significance level (typically 0.05) indicates that at least one group’s mean is significantly different from others.
- Degrees of Freedom: This includes both between-group and within-group degrees of freedom, which help contextualize the F-statistic.
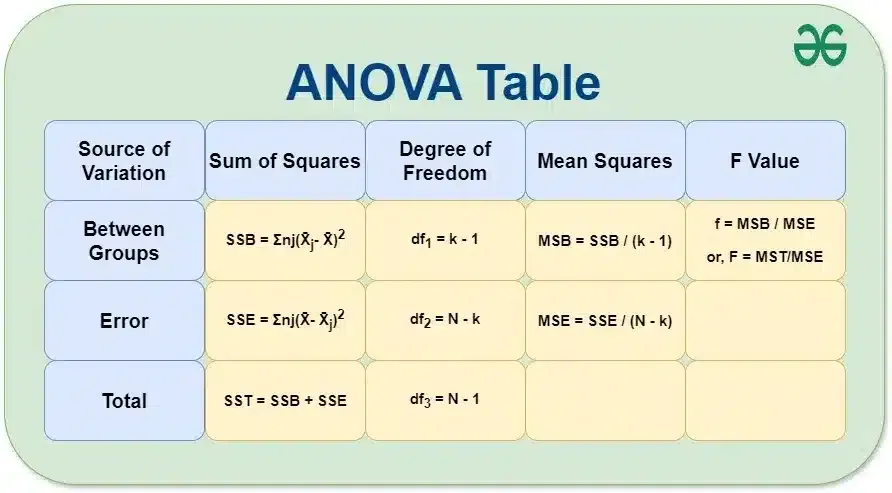
image source:geeksforgeeks
Example: In a marketing study comparing customer satisfaction scores across different service levels (e.g., basic, standard, and premium), a significant p-value would suggest that at least one service level provides a markedly different experience, guiding the company to investigate which service level has the highest satisfaction and why.
Conducting Post Hoc Tests to Understand Specific Group Differences
When ANOVA indicates significant differences, it does not specify which groups are different from one another. To explore these differences, post hoc tests (e.g., Tukey’s HSD, Bonferroni correction) can be conducted. These tests compare all possible pairs of groups to pinpoint exactly where the differences lie.
For instance, if the ANOVA results show significant differences in satisfaction across three customer segments, a post hoc test can reveal if the difference is between the basic and premium segments or between the standard and premium segments.
Example: A B2B company might use ANOVA to analyze employee satisfaction across departments. After identifying significant differences, they would employ post hoc tests to determine which departments are underperforming, enabling targeted interventions.
Translating Statistical Findings into Actionable Marketing Strategies
The ultimate goal of conducting ANOVA is to translate statistical findings into actionable strategies. Marketers must consider how to implement the insights gained from the analysis into real-world applications.
For example, if an e-commerce company discovers through ANOVA that customers in a particular demographic are significantly more satisfied with a specific feature, they might decide to market that feature more heavily to similar customers, thereby improving engagement and conversions.
Similarly, if a SaaS provider finds that customer satisfaction is notably lower in one subscription tier, they can investigate further, gather qualitative feedback, and implement changes to improve that tier, ultimately enhancing customer retention.
Common Pitfalls and Best Practices
While ANOVA is a powerful tool for analyzing data in marketing research, there are several common pitfalls that marketers should be aware of to ensure reliable and valid results.
Avoiding Common Mistakes in Applying ANOVA to Marketing Data
- Ignoring Assumptions: ANOVA relies on specific assumptions, such as independence, normality, and homogeneity of variances. Failing to check these assumptions can lead to inaccurate conclusions. Marketers should conduct tests (like Levene’s test for equality of variances) to validate these assumptions before proceeding with ANOVA.
- Using ANOVA When Not Appropriate: ANOVA is not suitable for all types of data or research questions. For example, if the data does not meet the necessary assumptions or if there are only two groups to compare, a t-test may be more appropriate.
- Neglecting Post Hoc Analysis: When significant differences are found, failing to conduct post hoc tests can leave marketers unsure about which specific groups differ. This step is crucial for deriving actionable insights.
- Overlooking Sample Size: A small sample size can lead to misleading results and reduced power to detect significant differences. Marketers should ensure their sample sizes are adequate to support robust conclusions.
Best Practices for Ensuring Reliable and Valid Results in Marketing Research
- Pre-Test Your Hypotheses: Before running ANOVA, pre-test your hypotheses to establish clear objectives. This clarity can guide your analysis and help avoid misinterpretations.
- Conduct Exploratory Data Analysis (EDA): Performing EDA helps identify patterns, trends, and potential issues in the data. Visualizations such as box plots can highlight differences between groups and indicate potential outliers.
- Document Assumptions and Findings: Maintain a detailed record of the assumptions tested, the findings, and the steps taken in your analysis. This documentation aids in transparency and can help when revisiting the analysis later.
- Engage Stakeholders: Collaborate with cross-functional teams to ensure that the insights derived from ANOVA are understood and utilized effectively. Marketing, sales, and product teams can provide valuable perspectives on how to implement findings.
Advanced Applications of ANOVA in Marketing
While traditional applications of ANOVA are valuable, advanced techniques can enhance the depth and breadth of marketing analysis, providing deeper insights into complex data sets.
Exploring Advanced ANOVA Techniques for Complex Marketing Studies
- Multivariate ANOVA (MANOVA): Unlike traditional ANOVA, which examines a single dependent variable, MANOVA allows for the analysis of multiple dependent variables simultaneously. This is particularly useful in marketing when researchers want to understand how different marketing strategies impact various outcomes, such as customer satisfaction, purchase intention, and brand loyalty all at once.Example: A tech company may use MANOVA to analyze how different advertising channels (social media, email, and traditional media) affect both brand awareness and purchase intent among consumers. This simultaneous analysis provides a more comprehensive view of marketing effectiveness.
- Analysis of Covariance (ANCOVA): ANCOVA combines ANOVA and regression, allowing researchers to control for the influence of covariates (extraneous variables). This technique helps isolate the effect of the independent variable(s) on the dependent variable by accounting for other factors that might influence the outcome.Example: An e-commerce platform could utilize ANCOVA to assess the impact of a new website design on conversion rates while controlling for variables like seasonal sales or traffic sources. This approach ensures that the results reflect the true impact of the design change rather than external influences.
- Mixed-Design ANOVA: This method combines within-subjects and between-subjects designs, allowing researchers to analyze both types of factors in a single study. Mixed-design ANOVA is particularly useful in marketing research involving repeated measures.Example: A restaurant chain could use a mixed-design ANOVA to evaluate customer satisfaction over time across different locations, measuring satisfaction before and after implementing a new menu while also comparing results between locations. This helps determine not only if the new menu is effective but also how its impact varies by location.
Integration of ANOVA with Other Statistical Methods for Comprehensive Analysis
Marketers can further enhance their analytical capabilities by integrating ANOVA with other statistical methods. This combination provides a more holistic understanding of data and enriches the insights drawn from marketing research.
- Regression Analysis: Combining ANOVA with regression analysis allows marketers to assess the relationship between dependent and independent variables while controlling for confounding factors. This integration can highlight how various marketing strategies contribute to overall performance.
- Cluster Analysis: By employing cluster analysis alongside ANOVA, marketers can segment their audience into distinct groups based on similarities. This segmentation enables targeted marketing strategies tailored to each group’s preferences and behaviors. Example: A SaaS provider could use cluster analysis to identify segments of users based on usage patterns and satisfaction levels, then apply ANOVA to analyze how different features affect satisfaction within these segments, enabling more personalized marketing efforts.
- Time Series Analysis: When analyzing marketing data over time, combining ANOVA with time series analysis can help identify trends, seasonal effects, and the impact of marketing interventions over time.
ANOVA into your research toolkit
ANOVA is an essential tool for business and marketing professionals looking to make data-driven decisions. By providing a robust framework for analyzing variance among different groups, ANOVA allows marketers to understand the effectiveness of their strategies and optimize their campaigns for better outcomes. As the marketing landscape becomes increasingly data-centric, incorporating ANOVA into your research toolkit can offer a strategic advantage in understanding customer behavior, preferences, and the overall impact of marketing efforts.
Adopting ANOVA not only enhances your analytical capabilities but also fosters a culture of evidence-based decision-making. By leveraging ANOVA, you can refine your marketing strategies, improve customer satisfaction, and ultimately drive growth and success.
FAQs
How to explain ANOVA results?
To explain ANOVA results, focus on the F-value, p-value, and the overall significance of the test. The F-value indicates the ratio of variance between groups to the variance within groups, while the p-value helps determine whether the results are statistically significant (commonly set at p < 0.05). A significant result suggests that at least one group’s mean is different from the others.
How to interpret the F-value in ANOVA?
The F-value is a ratio that compares the variance explained by the model to the variance within the groups. A higher F-value indicates a greater disparity between the group means relative to the variance within the groups. If the F-value is significantly large (and corresponds to a low p-value), it suggests that the independent variable has a meaningful effect on the dependent variable.
What is the key difference between ANOVA and MANOVA?
The key difference between ANOVA and MANOVA lies in the number of dependent variables analyzed. ANOVA is used when there is one dependent variable, while MANOVA is suitable for studies with multiple dependent variables. MANOVA helps researchers understand the interactions between independent variables on several outcomes simultaneously, providing a more comprehensive analysis.
Theory is nice, data is better.
Don't just read about A/B testing, try it. Omniconvert Explore offers free A/B tests for 50,000 website visitors giving you a risk-free way to experiment with real traffic.


AI-Powered CRO
Audit for eCommerce
Find your biggest conversion leaks in 15 minutes.
Benchmark UX, accessibility, and data hygiene then unlock tailored A/B testing ideas.
Unlock my CRO score

Sign up to our bi-monthly newsletter!
Actionable eCommerce insights only.

Master what matters most in eCommerce
✅ Get more loyal customers
✅ Improve Customer Lifetime Value
✅ Maximize profits
Discover all features30-day free trial, no credit card necessary.