


Here’s the thing about data: everyone has it.
Everyone wants it.
But few understand which data truly matters.
If you’re anxious about being buried under an avalanche of data and a never-ending demand for reports, know you’re not alone.
It’s a common headache in today’s business world.
eCommerce reporting can become a nuisance rather than an ally in a split second.
Done wrong, eComm reporting can lead to a tangled mess of information, riddled with errors, and leave your team drowning in work.
The end result?
Your business decisions become foggy, customer satisfaction takes a hit, and your profits disappear.
But there’s a way out of it.
Imagine a straightforward reporting system, one that zeros in on the metrics that genuinely affect your customers and your profits.
Sounds appealing, doesn’t it?
Today’s article will show you how to transform your reporting process and reclaim control of your business with automation, simplified reporting, and a CLV-focused approach.
Let’s start!
Introduction to Reporting in eCommerce
An eCommerce report is a compilation of data presenting a comprehensive insights overview of your business. This valuable resource offers a holistic perspective of your store, encompassing aspects such as products, orders, customers, and more.
Data-driven reporting is used by eCommerce professionals from all fields (marketing, product management, customer service, the C-suite, etc.) to see how different bits of information connect, compare, and add up, helping you get a clear picture of what’s happening in your business.
In short, you can boost decision-making and confidently implement effective and lasting growth strategies by merging accurate reporting with action-driven insights and focusing on customers.
Taking a closer look, here are some essential things you can find out using eCommerce reporting:
- Comparison:
You can put data side by side to see how similar or different your numbers are.
For instance, you can compare data from different periods or see how two distinct numbers relate to each other in a report.
- Relationship:
Reporting helps you understand how different pieces of data connect.
Reporting allows you to see if a metric, such as the number of unique visits, has anything to do with how often visitors complete a purchase. This way, you can take various metrics and uncover any correlation between them, enabling you to focus on actions that matter.
- Distribution:
This point helps you understand the frequency of an event in a set group of data points.
For example, you might want to identify whether customer lifetime value varies based on customers’ location, gender, or any other characteristics.
- Composition:
It is all about understanding the factors that make up a whole and piecing together your eComm puzzle.
In action, composition helps you understand where revenue comes from, what causes churn, why CLV is stronger within a particular customer segment, etc.
All things considered, there is a caveat to reporting efficiency: picking the right eCommerce success metrics to track and influence.
According to their relevance, you can include two types of KPIs in your reports: vanity and meaningful metrics.
Understanding Vanity Metrics
Despite their limited impact on the bigger picture, the temptation of vanity metrics can be intense.
But what are these metrics, and why are they dangerous?
Vanity metrics reveal seemingly impressive data points lacking the substance to guide your future strategies or assess your success.
These numbers, however impressive they may appear, can be easily manipulated—intentionally or not—creating a mirage of achievement that doesn’t align with your ultimate goals.
eCommerce professionals must look beyond shallow metrics for performance measurement
And move on to more meaningful metrics offering action-driven insights.
So, which metric should you avoid when KPI Tracking?
https://tenor.com/JdzV.gif
Classic examples of vanity metrics include social media followers, total customer counts, and page views.
But there’s no fixed menu of vanity metrics to look out for, as practically any eCommerce KPIs can assume a vanity role. To assess a metric’s relevance, you will need to consider:
- Your company’s development stage
- The goals you’ve laid out
- The external context of your industry
Let’s take social media metrics, for example.
A young start-up aiming to increase its visibility can benefit from including social metrics in its reporting strategies, as these KPIs measure brand relevance.
Conversely, a well-established business will be more interested in actionable metrics (such as the Lead Generation rate), minimizing the value of its social media follower count.
It all depends on your business maturity, goals, challenges, and strong points. To differentiate between vanity and actionable metrics, you can look at these straightforward factors:
Reliability
Trustworthy data paves the way for generating actionable strategies and harnessing powerful business intelligence tools. At the same time, unreliable or insignificant data increases the risk of being misled by vanity metrics.
You might lose data accuracy if you rely on a fragmented array of tools and apps. This situation leads to chaotic reporting and a lack of actionable insights that can move your business forward.
Context
Numbers can depict brighter or bleaker scenarios depending on how they’re presented.
For instance, a 200% MoM uplift in conversions might seem impressive at first glance.
However, if the previous month saw only a single ad conversion, that 200% figure suddenly represents a mere 3 total sales.
Or, a 1% decline in sales volume MoM is no reason to worry if those coincide with a predictable post-holiday lull from December to January.
Always consider the context for your metrics’ interpretation processes.
Reproducibility
Random spikes or drops in your performance cause alarm and demand your attention.
However, these statistical anomalies only remain actionable if you can identify the specific conditions that triggered them.
Reproducibility characterizes actionable metrics.
After all, addressing an outcome you don’t fully control and/or understand prevents you from achieving meaningful progress.
It’s important to note that vanity metrics aren’t entirely useless.
For example, data points such as customer engagement, social media followers, or traffic can indicate brand and product visibility shifts.
However, you should only include them in your eCommerce reporting process if it’s essential.
Some vanity metrics serve as a starting point leading to actionable ones (for instance, a user’s initial website visit before making a purchase).
Yet, your decision-making process should predominantly revolve around the numbers strongly linked to your financial goals.
Actionable metrics, without a doubt, should be the driving force behind your business choices.
Transitioning to Meaningful Metrics
Actionable (meaningful) metrics are precisely what they sound like: actionable.
They provide genuine value by enabling data-driven decisions, setting objectives, and changing unproductive business processes.
Reporting metrics such as net profits per transaction, revenue fluctuations over time, and sales conversion rates fall under actionable metrics.
In the vibrant and dynamic world of e-commerce and retail, customer-centricity is the currency for eCommerce growth.
To that end, when it comes to “meaningful” metrics, there’s no safer bet than the metrics’ transition toward CLV Metrics.
Let’s look at the numbers that reveal customers’ general and specific experiences with your brand, showcasing how you can shape and enhance these experiences.
One metric at a time.
Customer Lifetime Value (CLV) Metrics
Before we dive deeper into the world of Customer Lifetime Value (CLV) and truly geek out on the CLV importance, it’s essential to break down the components that play a pivotal role in both assessing and enhancing CLV.
Purchase Frequency (PF)
At the heart of customer interaction lies the Purchase Frequency metric, revealing the average number of orders individual customers place.
PF is more than just numbers; it’s a glimpse into how often your customers choose to engage with your products.
Screen-grab from Valentin Radu’s CLV Revolution book – read Chapter One for free!
Higher purchase frequency signifies engaged customers, while a dip might signal a need for attention.
Repeat Purchase Rate (RPR)
The RPR paints a picture of the % of customers who come back for more – placing at least two orders.
But here’s the twist: RPR offers a rearview mirror view of past behavior.
It’s a historical narrative, lacking the ability to predict future choices.
So, while the RPR tells a story, it’s only a chapter in the longer journey toward eComm success.
Customer Retention Rate (CRR)
CRR is the spotlight on loyalty, revealing the % of customers you’ve managed to keep within a specific time frame.
The opposite of customer retention rate is the churn rate, unveiling consumers who slipped through your fingers.
Screen-grab from Valentin Radu’s CLV Revolution book – read Chapter One for free!
Customer Lifespan (CL)
Imagine owning the ability to predict the future of customer interactions.
That’s the essence of CL and the true reason to calculate customer lifespan.
It predicts how long a customer will remain loyal, guided by your business model and churn patterns.
Just like predicting the weather, anticipating customer behavior requires catching the winds of retention and the clouds of churn.
CL is your compass, helping you navigate through loyalty landscapes.
Gross Margin (GM) and Costs of Goods Sold (COGS)
The GM and the COGS are the places where financials meet customer value.
Monitoring GM and COGS guides your pricing decisions, ensuring your strategy resonates with customers.
Customer Acquisition Cost (CAC)
The CAC reveals how much you spend to acquire a customer and how effective your Marketing Strategies are.
However, the CAC can only be accurate if correlated with the unique CLV of each customer. If the balance favors the acquisition cost, you’re spending more on that customer than the money he brings.
In this scenario, profitability differs from what you expected, even if costs are low.
Net Promoter Score (NPS)
The NPS is your glimpse into customers’ sentiments, measuring their likelihood of recommending you.
With a simple question, NPS unveils the % of promoters and detractors. It’s the heartbeat of customer loyalty, reflecting your brand’s impact on customers hearts.
All these metrics combined tell the story of your Customer Lifetime Value and, by extension, your customer retention game and your expected revenue.
But why Customer Lifetime Value?
In a few words, if profitability is your purpose, then CLV is the means. Let’s unpack the concept further.
Importance of CLV in E-commerce
Anyone who explores the potential of CLV uncovers valuable connections that bridge customer insights and operational excellence.
While not a magic bullet, a CLV Analysis empowers you to take what matters most – your profitability – and unpack its sources. Calculating Customer Lifetime casts a broader lens than any other metric, revealing who brings in money and who wastes your resources.
Calculating customer lifetime value is a step beyond your basic “run ads-convert people” approach to marketing.
Let’s look at the obvious.
If you’re following the crowd or relying solely on strategies from big players like Google and Meta, you’ll find yourself swimming against the tide in a competitive market.
It’s your choice to break free, experiment boldly, take calculated risks, and explore unconventional paths that can propel your business to new heights.
CLV enlightens your path, answering a simple question:
- Are you spending too much to get customers who might not stick around?
The answer is crucial, as eCommerce is about something other than getting customers or spiking conversion rates.
Profitability in eCommerce means nailing retention.
And since retention is so intricately tied to customer lifetime value, to improve retention, you first have to improve Customers’ Lifetime Value. Your growth strategy begins and ends with CLV Optimization.
Increase the dollars people spend on your products, and you’ll increase your profitability.
Yes, it is that simple.
Strategies for Simplifying Reporting
Generating reports is a mundane task in any business – name one professional who never had to fill out at least one Excel sheet.
Leaders demand reports to determine whether the company is in a position to celebrate achievements or needs to take corrective action to avert setbacks.
However, creating, sharing, and reviewing these reports happens so often that it’s easy to fall into a routine, get overwhelmed, or forget why you’re even generating these reports in the first place.
Let’s look at a series of reporting best practices to simplify your process and improve reporting efficiency and communication.
elementor-template id=”19741″
Manual Reporting Constraints
Believe it or not, large, enterprise-level eComm companies (with plenty of resources) still rely on manual methods to collect and process data.
Manual reporting was never a pleasant task, but today, as the digital landscape undergoes constant shifts, the process is more cumbersome than ever.
If you’re in this position, it’s time to reassess and embrace the power of automation.
Invest in cutting-edge tools and software solutions that can automate data aggregation from various channels and platforms.
Through this shift to automation, your reporting process will accelerate, and you’ll also see an uptick in precision and reliability.
Balancing Data Volume with Actionable Insights
Look around you: data flows abundantly.
The real challenge is turning data into actionable insights.
Perhaps you’re knee-deep in data, but extracting valuable and practical insights is difficult.
In this scenario, you must put quality before quantity.
Lose the vanity metrics discussed earlier and identify the KPIs matching your strategic goals.
Concentrate on the data that genuinely drives your business forward.
The rest is white noise.
You can also implement data visualization tools to manage large datasets, reveal essential insights, and unveil hidden trends and patterns within your data.
This approach enhances the effectiveness of your data visualization efforts, ensuring you get the most out of your data.
Data Inaccuracies
When you don’t have a single place to gather and analyze your digital shelf data, it can lead to differences in the numbers and information you use.
This scenario hurts reporting reliability.
As a solution, you should invest in a tool designed to help you analyze and manage data related to your online products, sales, customer behavior, and overall eCommerce performance. Tools using machine learning can go one step further and uncover granular insights about your loyal customers.
This way, you can have consistent and accurate data to work with.
At the same time, remember to check and clean your data regularly to ensure it remains trustworthy and dependable.
Fill Data Voids for Holistic Insights
Gaining updated data from various channels, such as individual stores or new fulfillment methods, is vital for making smart choices. But it can be challenging.
The solution invests in all-encompassing analytics tools highlighting the complete omnichannel landscape in real-time.
To simplify reporting, focus on platforms that offer insights into:
- how stores are performing
- what’s happening in specific product categories
- employee reviews
- your customer base
- revenue-related metrics
This broader view facilitates strategic decision-making, covering your entire digital world, including understanding customer behavior through analysis.
Aligning Teams for Success
When teams are on different pages, and information is all over the place, decision-making is a mess.
Get everyone on board by blending eCommerce reports with how your business runs.
Set up a central reporting system that lets different teams like finance, sales, marketing, and supply chain see the important stuff. Use easy-to-understand dashboards and visuals to show how eCommerce is doing and where you’re headed, getting everyone working together.
To summarize, eCommerce reporting has its hurdles, but you can tackle them smartly.
Use automation, focus on practical insights, combine your data, pick solid reporting tools, and team up across the board.
Doing these lets your business own those challenges and rock eCommerce with data-powered success.
Leveraging Data Visualization Tools
If data represents the puzzle pieces of your eComm picture, data visualization tools become the skilled hands that assemble those pieces.
We’ve discussed a lot about collecting data and choosing your relevant metrics. But that’s just step one.
For step two, data visualization comes in as a way of translating data into a story everyone can understand.
So, how does this mix of data and storytelling actually work?
Data visualization tools bridge the gap between numbers and decisions, helping the C-suite make smart choices.
How do these tools make data tell stories?
They whip up dashboards that take all that info and turn it into pictures, charts, and graphs – a visual representation of your numbers.
Here’s where Reveal by Omniconvert steps in.
Reveal transforms your data into actionable insights that enhance customer experiences and reinforce customer loyalty.
Discover Customer Insights with Reveal
An unhelpful consultant, an annoyed cashier, or a clueless store manager can drive customers away.
Reveal provides a comprehensive view, identifies patterns, and takes swift action to resolve issues, preventing physical outlets from causing customer churn.
Tracking NPS Pre and Post-Delivery
Every customer journey holds pivotal touchpoints for satisfaction.
Reveal enables continuous measurement of customer happiness. It reveals whether your business fulfills promises or needs improvement, bridging gaps and ensuring a seamless journey that boosts loyalty.
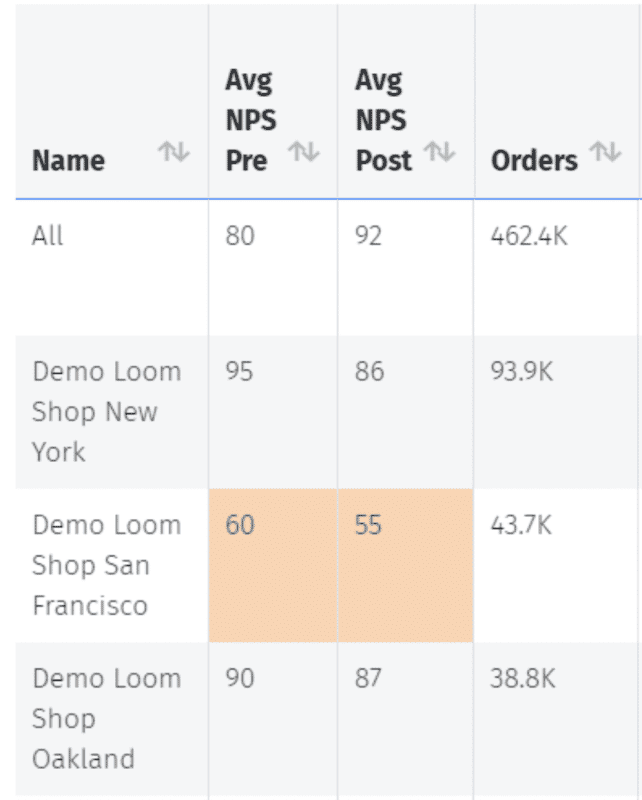
Location-Specific NPS Insights
Use the advanced NPS feature to pinpoint underperforming areas and avert potential crises, maintaining high customer satisfaction across your network.
Empowering Employee-Customer Interactions
Employee-customer interactions shape brand perception.
Reveal monitors experiences at every buying step, from cashiers to delivery teams, allowing you to intervene where needed.
Understanding Products, Brands, and Categories
Reveal delves into product perceptions. It shows how customers view your offerings, allowing swift issue resolution and consistent product quality.
Proactive NPS Alerts
Reveal’s NPS alerts act as an early warning system. Real-time notifications flag low NPS scores from high-value customers.
Immediate intervention can prevent loyal customer churn.
Customer Intelligence
Reveal’s Customer Intelligence Report provides valuable insights, including RFM segmentation, buying habits, and CLV. Tailor strategies to specific customer segments for better engagement.
Leveraging Buying Habits and Trends
Reveal’s Buying Habits & Movers/Shakers feature offers insights into repeat purchases and best-sellers.
Optimize campaigns and refine your product range with this knowledge.
Discover everything there is to know about Reveal!
Real-World Case Studies
When scouring the Internet for interesting case studies, we stumbled upon Duolingo’s unique growth strategy.
Duolingo employs an alternative approach, unlike many companies heavily invested in paid marketing.
As of early 2023, an impressive 80% of their user base originates organically, discovering the app through recommendations or social media channels.
Their strategy involves creating an exceptional free product, one that users find value in, eventually bringing users to pay for premium features.
Their growth model moves on from measuring new users in a void, focusing instead on Daily Active Users (DAUs).
Duolingo meticulously analyzes user states, such as New Users and Current Users, to gain insights into user behavior patterns.
This methodology acknowledges that user engagement is diverse and necessitates tailored strategies.
However, the story doesn’t stop here.
When noticing DAU growth, Duolingo moves on to further research to understand these people and anticipate their churn reasons.
Sometimes, people forget to complete a lesson, have technical difficulties, or simply want to take a break.
Duolingo goes deeper into the reasons, embracing advanced techniques to uncover intricate insights from their data.
These insights refine the growth model, proving Duolingo’s commitment to intelligent and sustainable growth.
The language learning platform has an exciting story, recognizing the importance of measuring the CLV of daily active users over short-term conversions.
People who download and install the app are no use for Duolingo. These users need more time to explore the product and opt for the premium version.
Instead, the platform decided to focus on Daily Active users, who keep returning for more and keeping them engaged with extra features such as the Streak Freeze.
(And an entire set of memes about Duo reminding learners to take their lessons.)

If you’re curious to learn more, check out the full Case Study here.
Future Trends in eCommerce Reporting
Considering the lightning speed at which things change in eCommerce, you must be aware of emerging eCommerce Trends.
Let’s explore the upcoming shifts that will shape the world of eCommerce reporting.
- A spike in real-time analytics
As the demand for instant insights rises, real-time analytics takes center stage in the analysis of your customer bases.
They empower agile decision-making to respond to market shifts and customer behaviors promptly.
- AI-powered predictions
Artificial intelligence and machine learning are more and more common in predictive analytics. These tools help businesses forecast trends, customer behaviors, and demand patterns.
- Omnichannel Integration
Omnichannel reporting becomes essential as customers engage across multiple touchpoints.
- Personalized Dashboards
Tailored reporting dashboards cater to different teams’ needs, enhancing the efficiency and relevance of insights.
- Data Democratization
Self-service platforms empower individuals without technical expertise to effortlessly access and comprehend data, nurturing a culture grounded in data-driven decision-making.
In essence, the horizon of eCommerce reporting is teeming with innovation.
However, one constant remains: customer satisfaction must be priority zero.
Failing to prioritize it only opens the door for more customer-centric competitors to swoop in and lure away your customers. And nobody wants that.
Wrap-Up
By now, you understand the pain of data overflow.
You know the frustration of chasing after metrics that don’t truly matter.
You’ve felt the impact of inaccuracy, overworked teams, and missed chances for real-time problem-solving.
But you also discovered the solution: simplifying your reporting efforts and focusing on CLV-related numbers.
This shift from quantity to quality, from vanity to substance, is the key to unlocking growth, retention, and success in the competitive world of eCommerce.
Good luck!
Frequently Asked Questions about Reporting
What is reporting in eCommerce?
Reporting in ecommerce involves the process of collecting, analyzing, and presenting data to gain insights into various aspects of an online business.
It helps track performance, identify trends, and make informed decisions to improve overall operations and customer experiences.
What are vanity metrics in eCommerce reporting?
Vanity metrics are data points that may look impressive on the surface but don’t provide meaningful insights into business performance.
These metrics often lack a direct correlation to business goals and outcomes. Examples include social media likes, page views, and raw website traffic.
What should be included in an eCommerce report?
Your report should include key performance indicators (KPIs) that align with the business’s goals and objectives.
This may include metrics related to sales, revenue, customer acquisition, conversion rates, customer retention, average order value, and customer lifetime value (CLV), among others.
How can CLV-related metrics simplify eCommerce reporting?
CLV-related metrics focus on the long-term value each customer brings to the business.
Instead of solely looking at short-term revenue, CLV considers the entire customer relationship, enabling businesses to make more strategic decisions around marketing, customer service, and retention efforts.
What are some common CLV-related metrics?
Some common CLV-related metrics include CLV, the CAC, the CLV to CAC Ratio, Repeat Purchase Rate, AOV, etc.