


Customer-centric eCommerce companies need a reliable product optimization framework to identify whether their product assortment is helping them achieve their goals or not: acquiring better customers, transforming new customers into repeat and loyal customers.
If you are focused on customer-centricity, increasing customer lifetime value is your top priority, and there are only three things your departments can do to improve this metric:
- Marketing – What do you say?
- Merchandising – What do you sell?
- Customer Experience – What do you do?
Despite being one of the most impactful pillars in CLV, product optimization research is often neglected and usually handled by the merchandising department.
But product optimization should be the result of interdepartmental collaboration. So, instead of working in separate silos, it’s time to shift towards customer-centricity and use a product optimization framework that allows you to analyze all the layers of product performance.
The product optimization framework will allow you to:
- Get rid of toxic products – those that look good in terms of sales volumes but generate customer dissatisfaction and high churn rates. The toxic products can be identified by looking at what first-time buyers and loyal customers that purchased and never turned back.
- Prioritize the sticky products – those that generate repeat purchases, high customer satisfaction, and loyalty. You can identify these products by looking at what products, brands, and categories your best customers prefer and keep on buying.
- Adding new sticky products to your offer – You need more sticky products to boost sales and increase the customer lifetime value. To identify new sticky products, you have to consider sales volume and the aspects that influence CLV – customer behavior and experience.
Based on a better product assortment, you’ll be able to create better offers to attract new and existing clients, build better experiences around your most loved products and generate more loyal customers.
The four data layers of the Product Optimization Framework
The product optimization framework you’re about to discover was created by our Omniconvert team and is an essential part of the customer value optimization process.
We’ve created this framework to help customer-centric companies look beyond typical product performance metrics and understand each item’s impact on customer experience and satisfaction.
For the relevance of the research, our advice is to extract data for the last 12 months and use the same set of products when applying all data layers of the product optimization framework.
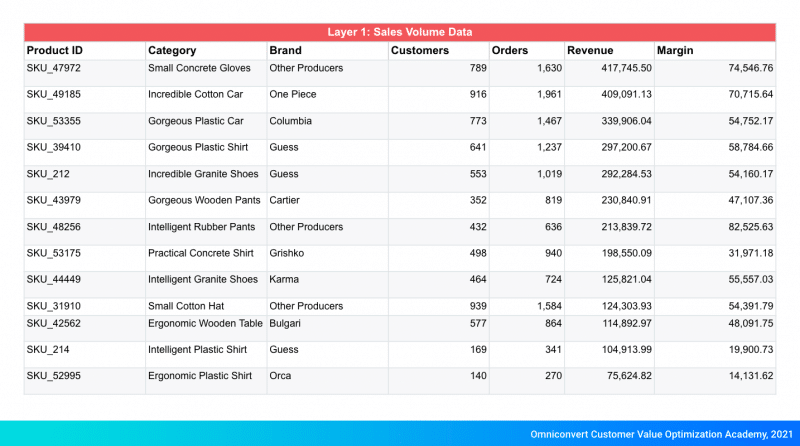
Layer 1: Sales Volume Data
Most of the stores analyze their product performance by looking solely at the sales volume data. You can extract this type of data from tools like Google Analytics or your eCommerce order management system.
Sales volume data helps you answer two essential questions:
- Which are our best-selling products?
- Which are the most profitable products?
The sales volume data you need to export is:
- Product ID
- Category
- Brand
- Customers
- Orders
- Revenue
- Margin
From a customer-centric perspective, sales volume data is necessary but not sufficient. The following three layers offer more clarity about the product performance through an analysis performed with the customer in mind.
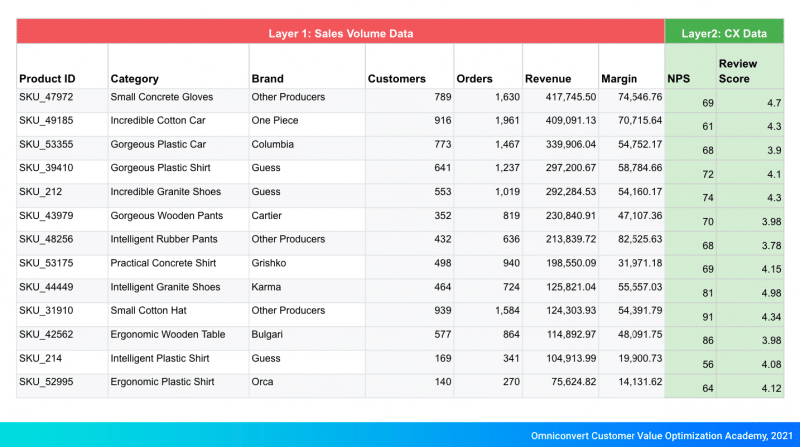
Layer 2: Customer Experience Data
The customer experience layer helps you understand how different products generate different levels of satisfaction.
There are two essential questions that you will find the answer to in this phase:
- Which are the most appreciated products?
- Which of your products create promoters or detractors?
To identify the most appreciated products, you need to look at the product reviews. You can extract them from your review app or, if you don’t have enough reviews for your shop, you can do a little market research and look at stores selling identical or similar SKUs. Looking at competitors’ reviews could also lead to new ideas to diversify your assortment with new sticky products.
To see if your products generate promoters or detractors, you must export the Net Promoter Score by product. Pre-delivery NPS helps you evaluate the shopping experience, and the post-purchase NPS enables you to evaluate the experience customers have by using your product. You’ll get a clearer image of what your customers love and are more likely to recommend to others by word of mouth, via social media, and so on. Also, you’ll see what causes poor experience and churn.
The customer experience data you need to export is:
- Product ID
- Category
- Brand
- Customers
- Orders
- Revenue
- Margin
- Net Promoter Score (NPS)
- Review score
Ideally, you’ll have both customer experience metrics available for analysis – the Net Promoter Score and review scores per each SKU or product.
Layer 3: Behavior Data
The behavior data layer helps you analyze what happens post-purchase with the customers depending on what products they purchased in the last 12 months.
By analyzing behavior data, you’ll be able to know:
- Which products are ruining the relations with our customers?
- What are our most loyal customers buying?
The behavior data your need to export is:
- Average RFM Impact
- Purchase Frequency
- Return Rate
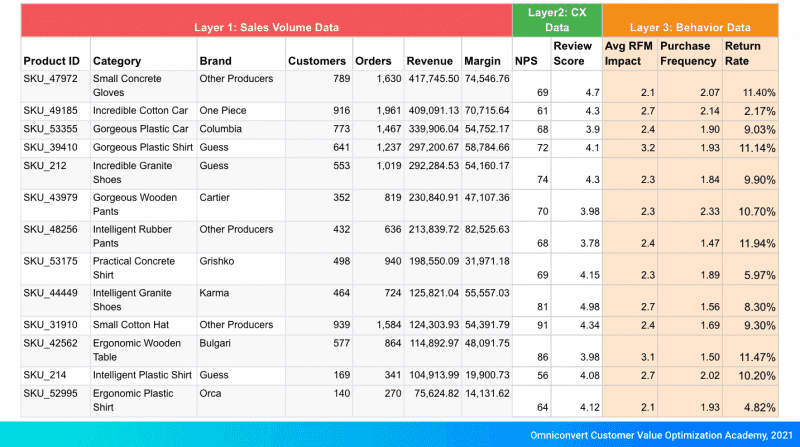
Let’s see how you calculate each metric:
Purchase frequency = Total number of orders/ Total number of customers;
Return rate = Number of returned products/ Number of sold products;
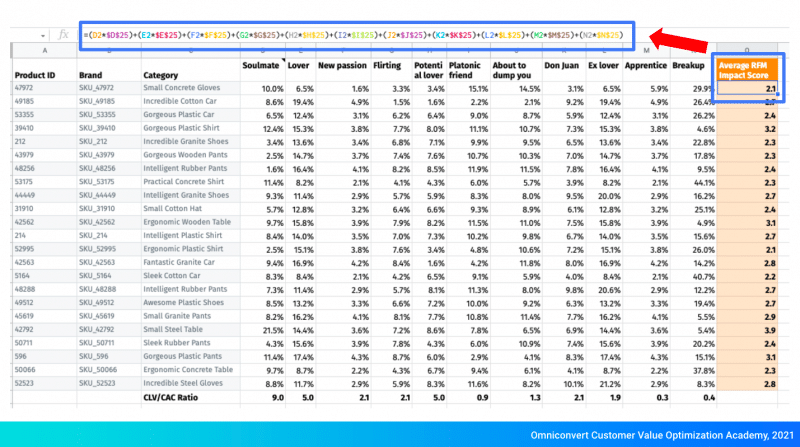
Average RFM Impact Score = SUM (density in the total sales in each RFM group x CLV/CAC ratio per group).
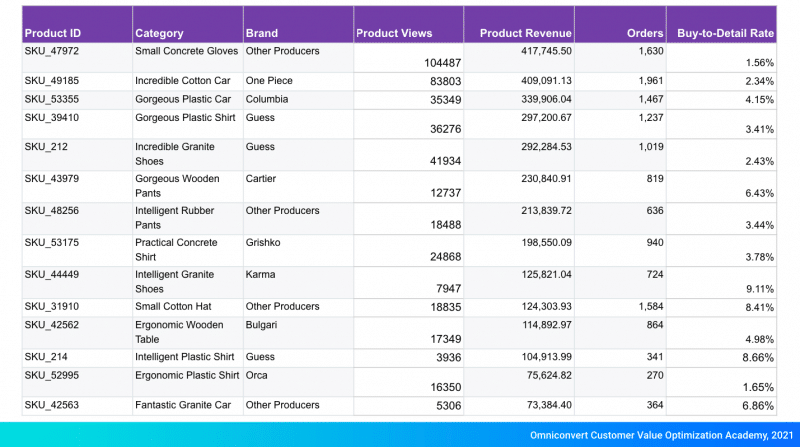
Layer 4: Intent Data
Most eCommerce companies are used to looking at conversion rates by traffic source, location, or device. For product performance analysis and assortment optimization, you need to calculate the conversion rate by product or the buy-to-detail rate.
Here’s the formula:
Buy to detail rate = Total number of orders/ Total product views.
The intent data your need to export is:
- Product ID
- Category
- Brand
- Product views
- Product Revenue
- Orders
- Buy-to-detail rate
How to analyze aggregated product data
Once you’ve gathered all the data for each layer in the product prioritization framework, you’re close to identifying the products that will help you improve your customer-centric approach.
When all the data layers are ready, you have two alternatives for analyzing product performance:
- Priority score calculation;
- High/low two-point scale.
Priority score calculation
The steps of the first analysis alternative are:
- Give a score for each attribute;
- Prioritize attributes;
- Establish a weight for each data layer;
- Calculate the priority score per product.
- Give a score for each attribute
You’ve gathered all the data and now have to normalize it. You will give a score to each attribute by using a scale from 0 to 100. For example, the best product in terms of the number of customers attracted gets the highest score.
- Prioritize attributes
Once you have the score for all attributes, it’s time to prioritize the attributes for each data layer depending on what you want to optimize. For example, if we’re looking at the sales volume data, the most important metric could be the margin or the customer count.
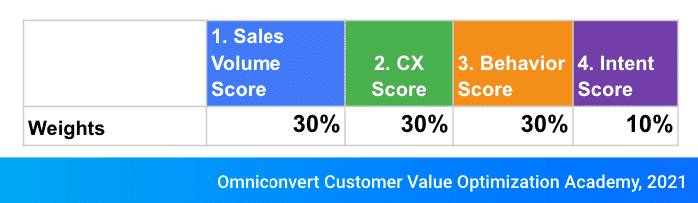
- Establish a weight for each data layer
The next step is to establish the weight for each data layer according to your business goals. If you’re heavily relying on customer acquisition, then give a higher weight to sales volume & Intent score. Otherwise, focus on customer experience and post-purchase behavior.
- Calculate the priority score per product
The priority score is a sum of all scores for each layer. The higher the priority score, the more resources you should invest in making those products visible to your potential and existing customers.
High/low two-point scale
The alternative to prioritization scoring is a two-point scale – high or low – to evaluate sales, retention, and customer experience.
To do this, you still have to calculate the score per attribute for each data layer, but you don’t need to calculate the priority score. Base on the aggregated score, you’ll be able to establish if a data layer value is high or low.
This alternative helps you split your product into eight categories and clarify how to optimize your product assortment.
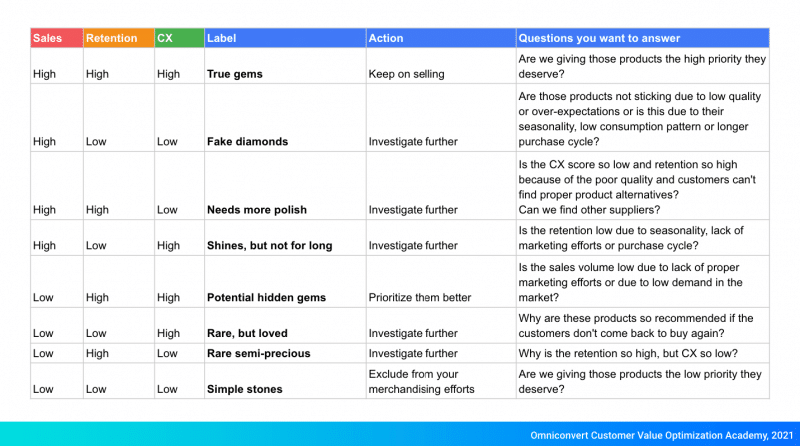
Let’s see what each label means and how you should approach each product type:
True gems are your best-sellers, and you have to make sure they get the attention they deserve by adding them on-site in the product recommendations section, building ads, creating excellent experiences around them.
Fake diamonds can be low quality/ over-promising products/ seasonal products/ products with low consumption patterns or longer purchase cycles.
“Needs more polish” are products that signal a problem in customer experience that you need to investigate further and see if you should replace the products or the suppliers.
“Shines, but not for long” products have low retention caused by purchase cycle, seasonality, or lack of marketing efforts, so you need to see how you can increase retention for these products.
Potential hidden gems are products with low sales volumes caused by a lack of proper marketing efforts or low demand in the market.
“Rare, but loved” are products that are not marketed enough but could be very appreciated as they are durable and long-lasting products.
Rare semi-precious are products that generate high retention caused by high necessity and few options on the market.
Simple stones are the products you should stop selling as they have low values for all data layers and don’t want them to cause more harm than they already did.
Although this product optimization framework takes some time, it’s one of the most effective ways to analyze and optimize product assortment with a customer-centric mindset.
The product optimization framework helps you design more customer-centric experiences and improve product management based on multiple data layers, including customer data.
As a result, your eCommerce store can generate better acquisition and retention thanks to better offers designed around an optimized product assortment.
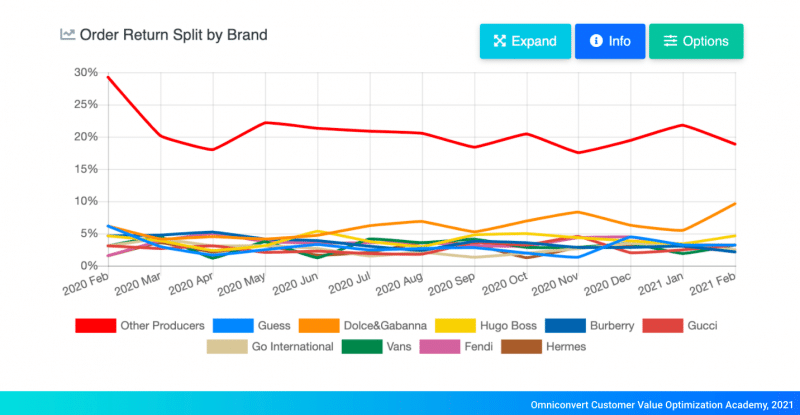
However, if you don’t have enough data or resources to perform this quantitative analysis, you can spot the toxic products by monitoring the order return rate by product, brand, category.
Wrap up
Along with CLV and cohort analysis, product assortment optimization represent one of the most important elements of quantitative research and an essential pillar in the customer-centric strategy of a company.
The product optimization framework allows you to analyze your current assortment in-depth and identify products that need further investigation through qualitative research.
To help you perform the analysis, we’ve prepared a template that you can download and use as an internal resource across departments.
Frequently asked questions about Product optimization framework
What is a product optimization framework?
A product optimization framework is a systematic approach or methodology used to improve and optimize a product or service to better meet user needs, achieve business goals, and drive overall success. It provides a structured framework for identifying areas of improvement, prioritizing optimization efforts, and implementing changes to enhance the product’s performance, usability, and value.
Why is a product optimization framework important?
A product optimization framework is important for several reasons:
Continuous improvement: It fosters a culture of continuous improvement, allowing businesses to enhance their products over time based on user feedback, market trends, and evolving needs.
Enhanced user experience: By systematically optimizing a product, businesses can improve the user experience, addressing pain points, streamlining workflows, and providing features that align with user expectations and preferences.
Increased competitiveness: Optimizing a product enables businesses to stay competitive in a fast-paced market. By addressing weaknesses, enhancing strengths, and offering a superior user experience, businesses can differentiate themselves from competitors.
Better business outcomes: A well-optimized product can lead to better business outcomes, such as increased customer satisfaction, higher retention rates, improved conversion rates, and increased revenue.
What are the key components of a product optimization framework?
The key components of a product optimization framework may vary, but some common elements include: Data analysis, Goal identification, Prioritization, Hypothesis development, Testing and experimentation, Iterative implementation. Implement the identified optimizations in an iterative manner. Monitor and evaluate the impact of each change, gather user feedback, and iterate on the improvements based on the insights gained.
Download The 4 Data Layers Product Optimization Framework template