


What’s the common link between passionate love affairs and a thriving eCommerce business?
The relationships.
Now that we have your eye let’s talk a little about Product Affinity and Relationships. Think of it like a love story between you, your customers, and the products they can’t get enough of.
(it’s not a love triangle if everyone is happy)
In today’s post, we’ll walk you through product affinity, showing you how to use it to create marketing campaigns that deliver precisely what people need (when they need it.)
It’s like magic – only it’s science.
We’ll walk through the fascinating world of Data Science (with a shortcut, if you’re not a numbers man), the steps for effective product affinity analysis, and a final pitstop at the eCommerce metrics related to this topic.
Let’s ride!
What Is Product Affinity?
In eCommerce and Retail, product affinity represents customers’ tendency to buy certain products together.
Product affinity reveals the combinations in which the items are purchased and offers insights for upsell campaigns or recommendations inside the eCommerce site – thus increasing the revenue per visitor.
For example, suppose your customer adds to the cart a new camera. In that case, you can recommend additional accessories like camera bags, extra batteries, and lenses.
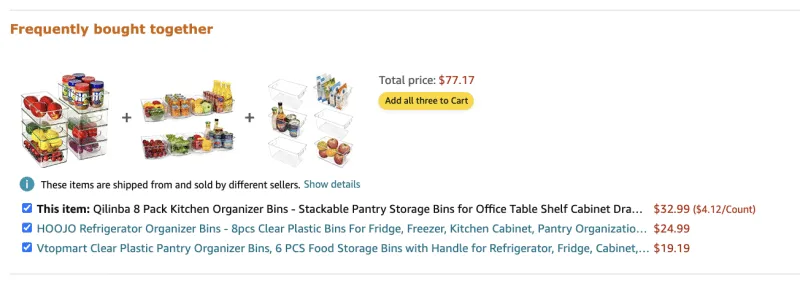
Here’s a real-life example of product affinity in action from Amazon.
After we’re done browsing and picking our products, Amazon includes a final step in the checkout process, offering us complementary products. If we accept buying the extra items, our Average Order Value will increase:
Why Is Product Affinity Useful?
Considering how expensive customer acquisition has become, plus the natural consumers’ reluctance to spend their hard-earned money, bringing in new customers has become a tremendous mental and financial effort.
You strive to persuade people to become your clients, but you never see them again. That’s no way of growing – growing is the consequence of retention.
And retention happens when you anticipate customers’ needs and orchestrate tailored experiences for each customer type. No one says you shouldn’t try and get higher ROIs on the acquisition cost, but you have to do it smartly.
Here’s where product affinity becomes a powerful ally – it allows you to understand which products are most popular among your customers and how they are related. This information is your gold mine when you’re crafting your sales & marketing strategies.
Another way of lowering your customer acquisition costs with product affinity is using granular targeting in your ads. When you’re aware of products pairing well together and their popularity amongst customer segments, you can focus your marketing efforts on that product and that customer segment.
And, as a final argument, product affinity analysis helps you identify new opportunities – such as new products that will be particularly appealing to your most valued customers.
Without it, you make gut decisions and tailor your strategies to trends. With it, you make data-driven decisions with higher chances of success.
And by success, we mean improved customer retention, increased gross profit, and better customer lifetime value.

What Is Product Relationship?
Unlike product affinity, which is more customer-centric, product relationship refers to how products inside your platform relate to each other.
These relationships between products can include complementary, replacement, or competitor products.
For example, suppose someone adds a pair of training weights to the cart. In that case, your platform could recommend additional products, such as resistance bands, yoga mats, or protein supplements.
However, the recommendations continue – you can continue to showcase other models or brands similar to the one the customer bought.
These small actions serve consumers’ needs of having a variety to choose from while providing a more convenient shopping experience.
Product Affinity Analysis
Product affinity analysis is the act of mining through your data to identify patterns in customer purchasing behavior. It aims to understand which products are often bought together by customers and increase their cross-selling potential.
Product Affinity Analysis is also known as Market Basket Analysis – but the concepts are the same.
There are four steps to effective product affinity (or market basket) analysis. However, you will need an understanding of statistics and data science to go through all steps successfully and reach relevant conclusions.
Step 1 – Gather Your Data
The first step is gathering all customer behavior data. Look for data on the transaction history, purchase history, purchase frequency, and even monetary values.
Note that customer transactions are the primary source of affinity analysis. This cuts your work in half, as you’ve been collecting this data anyways.
You can be self-sufficient in gathering your transaction history since you don’t have to rely on third-party tools or websites to collect this information.
Gathering your data involves importing your customer data into a Customer Analytics platform. If you haven’t yet invested in one, it’s time to consider the available options.
This will allow you to evaluate your Market Basket (the items commonly purchased from your store) and see which product combinations generate the most profitable profit margins.
Step 2 – Analyze Your Data
In the next stage, your customer insights platform (or tool) will analyze the data related to purchase behavior and identify customer purchase patterns over a set period of time.
The insights revealed in this step include product bundles often purchased together, combinations that increase the Customer Lifetime Value (CLV), or even customer groups with similar purchasing patterns.
Step 3 – Draw your conclusions
This step is self-explanatory. Look at the numbers and identify product groupings and products often bought together.
There are three main metrics to keep an eye out for in this step:
- The “Support” metric
Support shows you how popular a product grouping is.
- The “Confidence” metric
Confidence shows the likelihood of certain products being bought together.
- The “Lift” metric
This metric (lift) shows you whether or not combining two products inside the product suit will improve the chances of making a sale.
It’s important to note that while following metrics and KPIs isn’t as sexy as bold marketing schemes, data will always reveal the truth about your business.
In the analysis market, we look at numbers and cold facts to inform our decisions and increase the probability of increasing the average profit.
This brings us to the final (and most exciting) step of product affinity analysis.
Note: if you’re not a numbers person, you hate looking at data, or you need more confidence in your expertise, let’s talk!
Our Managed Services branch is filled with talented data analysts and CRO specialists, ready to scour your data for hidden gems and golden insights.
We will look at your numbers, then develop testing and improvement ideas that can consistently lift conversion, retention, and ROI rates.
Just book a short call, and we’ll take it from there!
Step 4 – Applying the Findings
Now it’s the time to implement all your insights into marketing strategies that increase your profits and lower the churn rate (through personalized experiences).
Here are some areas where product affinity analysis can increase the conversion rate and your overall revenue:
- Product Bundles
When you see a pattern in items bought by your repeat customers, you can be proactive and create a pairing of product bundles with a special discount.
While reducing the price of your products might seem counterintuitive, this small discount can increase customer loyalty and bring people back to your shop.
- Cross-selling and upselling recommendations
The Customer Acquisition Cost (CAC) is insane, so getting new customers monthly isn’t the most brilliant move.
However, product affinity analysis empowers you to increase the average order value of your customers by orchestrating cross-selling and upselling recommendations.
Once a customer adds a product to his cart, you can display a recommendation for a complementary product or an upgrade to the item in the cart.
Just be mindful of your messaging. An aggressive call to action might frustrate the customer and lead to cart abandonment.
- Product placement
Even if this rule applies more to brick-and-mortar stores, it doesn’t mean you shouldn’t be mindful of your store’s organization and how each product category is presented.
Product placement is the strategic positioning of your products, meant to increase visibility and sales.
In the data analysis step of this process, you discover which products pair well together and the items with low compatibility. Use this information to organize your products inside your stores and increase the monetary value of customers’ purchases.
Before we close this chapter, we must look at the two types of product affinity analysis and how they drive even more insights from customers’ purchasing behavior.
- Predictive product affinity analysis
- Differential product affinity analysis
In predictive analysis, you run the data on all stores looking for patterns, no matter the variables.
While a similar process, in differential analysis, you consider all your vendor platforms (it can be multiple offline stores, third-party platforms, etc.) and compare the findings between the platforms.
For example, suppose you have a product bundle that’s very popular in one location but unpopular in another. In that case, you must identify the factors responsible for the variation.
This usually reveals hiccups inside the customer journey or weak spots you need to eliminate, thus decreasing the shopping cart abandonment rate.
Why Are KPIs Important?
Product affinity analysis only functions when you have enough data to get statistically relevant insights. Your online store needs to be on track and optimized to turn website traffic into conversions.
This warrants a discussion about key performance indicators (KPIs) focusing on website KPIs.
eCommerce KPIs provide a measurable way to track the progress toward your goals and objectives.
Moreover, they allow you to shine a mirror on your business and track your performance in key areas crucial to your organization’s success: sales, marketing, customer service, etc.
A performance indicator is an X-Ray showing you underperforming processes that may need your attention.
Types of Key Performance Indicators
While there are many eCommerce metrics in the industry, we can very easily classify them according to the areas they represent. Here’s a loose breakdown of eCommerce KPIs and their purpose.
- Sales and Revenue KPIs
Simply put, these performance indicators track how much money you produce with your business. These metrics are the total revenue, cost of goods sold, growth rate, average order value, and conversion rate.
- Traffic and Engagement
This category is mainly focused on the performance of your website. It reveals how well you’re doing in terms of attracting and retaining customers.
Tracking and improving website KPIs is crucial if you want to extract as much value as possible from your product affinity analysis.
With these performance indicators, you want to see how engaged your site visitors are with the content you’re displaying and whether or not they find your business relevant to their needs.
Traffic and engagement KPIs include the number of unique visitors, page views, bounce rate, and time on site.
We’ll discuss each in more detail soon.
- Marketing and Advertising KPIs
Here’s where you evaluate your marketing and advertising efforts. How good of a job did you do at verbalizing your products’ value to the customers?
How persuasive and effective were you?
The answers are found in KPIs such as the clickthrough rate (for Ads), the cost per click, the return on investment (ROI), or the sold cogs.
- Customer Service KPIs
In the era of customer-centricity, you must track and improve your customers’ experience. KPIs in this category allow you to evaluate customer satisfaction with your operations.
Whether it’s about the convenience of the shopping experience, the quality of your products, or the effectiveness of your customer service departments, the higher the satisfaction, the better your customer lifetime value.
Track metrics such as response time, resolution time, and customer satisfaction ratings to see what type of experiences you’re offering.
- Inventory and Logistics KPIs
Let’s remember the physical part of your store: your products.
With these final KPIs, you can track how efficient your inventory and logistics operations are. You should pay attention to metrics such as stock turnover, order fulfillment time, and delivery time.
eCommerce Metrics to Track
Now that you know more about eCommerce metrics, let’s dive deeper into metrics specifically related to your website – and their role in helping you identify patterns and trends in website traffic and engagement.
- Cart Abandonment Rate
The abandonment rate is the % of prospects who add items to their shopping cart without completing the purchase.
High shipping costs influence the shopping cart abandonment rate. Other factors involved in prospects abandoning the shopping process are a complicated checkout process, lack of trust in the website, lack of payment options, unexpected costs, etc.
To calculate the cart abandonment rate, you must divide the number of abandoned shopping carts by the total number of initiated checkouts.
If the rate is too high, it might signal you need to be targeting or communicating effectively with your customers.
- Bounce Rate
This metric tracks the % of visitors who leave your store after only viewing one page.
A high bounce rate shows you that the website isn’t providing the experience visitors are looking for, and it’s a signal you need to re-evaluate the website’s content.
To calculate your bounce rate, you need to divide the number of single-page sessions (people exiting without performing other actions) by the full sessions on the site (total visitors on your page).
For example, say 150 visitors land on your website, from which 15 exit without clicking. Your bounce rate will be 15/150 = 0.1%.
- Time on Site
This one shows visitors’ time on your website over a given period. The longer the time spent on your site, the more engaged your visitors are (and the better your content is).
To calculate the time on site, you need to calculate the difference between the point when a visitor lands on the page and the one where they move on to another page.
Note: If the visitor exists without clicking on another page, then time on site = 0.
If you’re curious amount eCommerce KPIs and their influence on your decisions, online presence, or customer acquisition and retention, check out this article. We explained the top eCommerce metrics and KPIs helping you track your performance.
Wrap-Up
And there you have it. Product affinity is the key to finding your customers’ product soulmates and how to bring them together happily (and profitably) ever after.
Remember – we always have your back if you’re not in the numbers-crunching mood. We’re just a short call away, so swipe right, and let’s see if this beginning can become a beautiful relationship.
Happy selling!
Frequently Asked Questions about Product Affinity and Relationships
What is product affinity KPI?
Product affinity represents customers’ tendency to buy certain products together. When conducting product affinity analysis, you need to measure the “support” metric, the “confidence” metric and the “lift” metric.
What are the most important KPIs for eCommerce sites?
The main KPIs you should track to measure the effectiveness of your website are the Bounce Rate, the Time on Site, and the Cart Abandonment Rate.
What KPIs are used to measure the success of the product and the product team?
To measure the success of a product and the product team, you can track the following KPIs: product adoption rate, product engagement, product retention rate, and product revenue.
What are the 5 key performance indicators?
Revenue – the financial performance of a business. Gross margin – how much revenue is left after subtracting the cost of goods sold.Customer Acquisition Cost (CAC) – the cost of acquiring a new customer. Customer Retention Rate (CRR) – the percentage of customers who continue to do business with your company over a given period of time. The Net Promoter Score (NPS) – customer likelihood of recommending you.
What are the key performance indicators in eCommerce?
The first KPI that should become your North-Star Metric is Customer Lifetime Value. Then come the revenue KPIs, such as the Average Order Value and the Gross Profit. You should also track customer satisfaction and the NPS for customer experience. Finally, you have your marketing KPIs – the Cost of Customer Acquisition, Conversion Rate, and Retention Rate.