


Net Promoter Score (NPS) has become a go-to metric for businesses looking to measure customer loyalty and satisfaction. It provides a simple yet powerful way to assess how likely customers are to recommend a brand to others. However, many companies make the mistake of treating NPS as just another KPI—collecting scores without truly analyzing the responses or taking meaningful action based on the insights gathered.
Understanding the “why” behind an NPS score is where real value lies. A high NPS might indicate strong brand loyalty, but what specifically is driving that loyalty? Likewise, a low NPS can highlight problem areas, but without additional context, businesses might struggle to address the root causes effectively. This is where best practices in NPS surveying, analysis, and follow-ups come into play.
This guide will walk you through proven strategies to extract deeper insights from your NPS surveys. From structuring your survey correctly to analyzing responses and using data for meaningful business improvements, these best practices will help you go beyond the score and uncover actionable insights that drive real growth.
What is an NPS Survey? Understanding Pre- vs. Post-Delivery Surveys
An NPS survey is a customer feedback tool designed to measure customer loyalty by asking a simple yet impactful question:
“How likely are you to recommend [brand/product/service] to a friend or colleague?”
Respondents answer on a 0-10 scale, where:
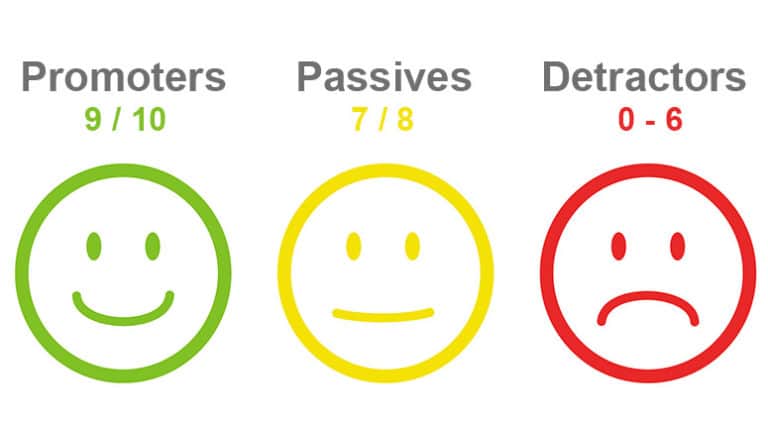
- Promoters (9-10) are highly satisfied customers likely to recommend your brand.
- Passives (7-8) are neutral customers who are satisfied but not particularly loyal.
- Detractors (0-6) are dissatisfied customers who may churn or spread negative feedback.
While the core NPS question remains the same, timing and context significantly impact the insights you gather. One key factor to consider is whether to send an NPS survey pre-delivery or post-delivery, as each provides different types of data.

Pre-Delivery NPS Surveys: Measuring Expectations
A pre-delivery NPS survey is sent before the customer has fully experienced the product or service. This approach is useful for evaluating brand perception, purchasing experience, and initial expectations.
For example, an eCommerce store might ask new customers how likely they are to recommend the brand right after completing a purchase. The response will be based on factors such as:
- The ease of the shopping experience.
- Pricing, promotions, and competitive value.
- The clarity of product descriptions and the checkout process.
Pre-delivery NPS scores offer early-stage insights into what attracts customers and any potential friction in the buying process. However, since these responses are based on expectations rather than real experiences, they should be analyzed separately from post-delivery data.
Post-Delivery NPS Surveys: Evaluating Real Customer Experience
A post-delivery NPS survey is sent after the customer has had sufficient time to use the product or service. This approach helps measure customer satisfaction, product quality, and overall experience.
For instance, a subscription-based SaaS company may send an NPS survey 30 days after onboarding, ensuring users have had enough time to explore the platform. Similarly, an airline might send a survey after a passenger has completed their flight to assess the service quality, in-flight experience, and overall satisfaction.
Post-delivery surveys provide more accurate and actionable insights since they reflect real customer interactions rather than expectations. The feedback gathered from detractors can highlight pain points that need fixing, while promoters’ responses can reveal what keeps customers engaged and loyal.
Best Practices for Getting More Insights from Your NPS Surveys
Collecting Net Promoter Score (NPS) data is only the first step in understanding customer sentiment. However, businesses must go beyond the basic score and extract deeper, actionable insights to unlock their full potential. Analyzing NPS responses effectively can reveal customer pain points, growth opportunities, and loyalty drivers—but only if the survey is structured and interpreted correctly.
To get the most out of your NPS surveys, it’s essential to ask the right follow-up questions, personalize responses, time your surveys strategically, and benchmark against industry standards. Below, we explore key strategies to optimize your NPS surveys and gain deeper insights from customer feedback.
Structure Your NPS Survey for Maximum Insights
The effectiveness of an NPS survey depends not only on the questions you ask but also on how the survey is structured. A well-designed survey ensures higher response rates, more accurate insights, and a better understanding of customer sentiment. When surveys are too long, poorly formatted, or biased in their wording, they fail to deliver actionable data. Businesses often overlook these factors, leading to low-quality responses that do not reflect real customer opinions. To ensure that an NPS survey delivers meaningful insights, it must be clear, concise, and strategically structured.
1. Keep It Concise: The Ideal Survey Length & Format
One of the most common mistakes businesses make with NPS surveys is making them unnecessarily long. The more questions included, the lower the response rate. Customers have limited time and are unlikely to complete surveys that require too much effort. Keeping the survey short increases the likelihood of getting thoughtful responses.

The ideal structure of an NPS survey consists of three core elements. First, the NPS rating question asks customers how likely they are to recommend a company’s product or service on a 0-10 scale. This is the foundation of the survey and helps classify respondents into Promoters (9-10), Passives (7-8), and Detractors (0-6).
Second, the survey should include at least one open-ended follow-up question. The goal is to go beyond the numerical score and gather qualitative feedback. A simple but effective approach is to ask, “What is the main reason for your score?” or “How can we improve your experience?”. These questions encourage respondents to elaborate on their thoughts, providing valuable insights into their expectations, frustrations, and overall satisfaction.
Finally, an NPS survey can include one or two additional questions, but only if they provide relevant context. For instance, a company may ask about specific aspects of the customer experience, such as product quality, ease of use, or customer service interactions. However, unnecessary questions should be avoided to prevent survey fatigue.
2. Craft the Right Questions: Scales, Formats & Wording
The way survey questions are framed has a direct impact on the quality and reliability of responses. You must ensure that their questions are clear, neutral, and easy to understand. A poorly worded question can lead to misinterpretation, biased answers, or incomplete data.
The 0-10 scale is the industry standard for the main NPS question because it allows for a clear segmentation of respondents into Promoters (9-10), Passives (7-8), and Detractors (0-6). This standardized format ensures consistency across industries and provides a reliable way to compare customer sentiment over time.
However, this should be the only question in your survey that uses a 0-10 scale. Follow-up and supporting questions should use response scales that match the type of insight being gathered. Mixing different types of questions with a 0-10 scale can create confusion and lead to inconsistent data interpretation.
While the 0-10 scale is exclusive to the main NPS question, follow-up questions require a different approach to gather more precise insights from customers. Choosing the right response scale depends on the type of data you’re trying to collect, the level of detail needed, and the ease of response for participants. Below are the most commonly used scales in NPS follow-up surveys, along with their best use cases.
1. Likert Scale (1-5 or 1-7)
A Likert scale measures a respondent’s level of agreement, satisfaction, or sentiment on a specific topic. This scale is useful when you need a nuanced understanding of customer opinions beyond a simple yes or no.
- Best for: Customer satisfaction, ease of use, or feature evaluations.
- Example question: “How satisfied are you with our customer support?”
- Response options:
- 1-5 scale: Very Unsatisfied – Unsatisfied – Neutral – Satisfied – Very Satisfied
- 1-7 scale: A more detailed variation that includes slightly satisfied/dissatisfied options for more granular feedback.
2. Binary (Yes/No) Scale
Binary questions provide a straightforward and quick way to gauge a customer’s perception, making them ideal for decision-based questions that require a clear-cut response.
- Best for: Gauging whether a specific condition applies to the customer.
- Example question: “Would you recommend our service to a friend?”
- Response options: Yes / No
This format is ideal for follow-up segmentation. If a respondent selects “No,” the survey can branch into an open-ended question asking them to specify why they wouldn’t recommend the service.
3. Visual Rating Scales (Smiley Faces or Stars)
Visual rating scales provide a more engaging and intuitive way to collect feedback, especially in mobile-friendly surveys where ease of response is crucial.
- Best for: Quick feedback, emotional response measurement, and user experience ratings.
- Example question: “How was your experience using our app today?”
- Response options:
- Smiley faces: A range of expressions from 😡 (very unhappy) to 😀 (very happy).
- Star ratings: Typically 1 to 5 stars, where more stars indicate higher satisfaction.
These scales simplify the feedback process, making them perfect for casual interactions, in-app surveys, and quick post-purchase reviews.
4. Numeric Scales (1-10, 1-100, or Custom Ranges)
Numeric scales allow for greater flexibility when measuring perceptions over a broad spectrum. While they can be detailed, they may require clear labeling to avoid confusion.
- Best for: Measuring perceived value, pricing satisfaction, or likelihood of repurchase.
- Example question: “On a scale from 1-10, how valuable do you find this feature?”
How to Choose the Right Scale
- For detailed opinions: Use Likert scales to measure satisfaction, agreement, or ease of use.
- For simple yes/no answers: Use binary scales to filter customers into groups.
- For fast and engaging feedback: Use visual rating scales like smiley faces or stars.
- For broad numeric insights: Use custom numeric scales but ensure clear labeling.

For example, if a company wants to gauge customer satisfaction with a specific service feature, a 1-5 Likert scale may be more appropriate. This scale provides a balanced range of responses, such as “Very Unsatisfied” to “Very Satisfied.” Similarly, for quick feedback, companies can use visual rating scales, such as smiley faces or star ratings. This approach is especially useful for mobile surveys, where users prefer a faster response method.
Another key consideration is avoiding leading questions. A biased question, such as “How much do you love our new feature?”, assumes that the customer already likes it. Instead, a neutral phrasing like “How would you rate your experience with our new feature?” provides a more accurate reflection of customer sentiment. Additionally, it’s crucial to use simple and direct language, avoiding technical jargon that may confuse respondents.
Create Neutral and Clear Survey Questions
The way a question is phrased can greatly impact the accuracy of customer feedback. Leading or biased questions can unintentionally push respondents toward a particular answer, while complex wording can confuse them and lead to unreliable data. To ensure your NPS survey collects genuine, actionable insights, focus on using neutral, clear, and direct language.
Use Neutral Wording to Avoid Bias
Instead of focusing on what not to ask, let’s look at examples of how to phrase questions correctly for objective responses.
✅ Use this: “How would you rate your experience with our new feature?”
❌ Avoid this: “How much do you love our new feature?”
✅ Use this: “How satisfied are you with the support you received?”
❌ Avoid this: “Was our customer service excellent?”
✅ Use this: “How likely are you to use this feature again?”
❌ Avoid this: “You’ll use this feature again, right?”
By keeping questions neutral, businesses allow customers to express their true opinions, leading to more reliable insights.
Keep Language Simple and Avoid Jargon
Customers engaging with your survey may have varying levels of familiarity with your product, service, or industry. Using complex terminology or insider jargon can lead to confusion and incomplete responses.
✅ Use this: “How easy was it to use our mobile app?”
❌ Avoid this: “How intuitive was our app’s user interface?”
✅ Use this: “Did you find what you were looking for?”
❌ Avoid this: “Did our navigational taxonomy align with your search intent?”
✅ Use this: “Was the checkout process smooth for you?”
❌ Avoid this: “Did our payment processing system function as expected?”
Simple, straightforward language ensures that all customers—regardless of background—can provide accurate feedback without confusion.
–> Check here 21 examples of winning NPS questions.
3. Open-Ended Follow-Up Questions: Extracting Valuable Insights
While the numerical NPS score provides a broad measure of customer sentiment, it does not explain why customers feel the way they do. The real value of NPS surveys comes from open-ended responses, which offer deeper insights into customer preferences, frustrations, and expectations.
To maximize the effectiveness of open-ended questions, they must be designed to encourage detailed feedback. A vague question such as “Can you tell us more?” may not prompt useful responses. Instead, you can ask specific yet flexible questions. For instance, “What influenced your score the most?” or “What could we do to improve your experience?” helps guide the respondent while still allowing them to express their opinions freely.
It is also beneficial to customize follow-up questions based on the respondent’s NPS score. A promoter who rated the company a 9 or 10 can be asked, “What do you love most about our service?”, helping the business identify its strengths. A passive respondent (7-8) may be asked, “What could we improve to make your experience even better?”. Meanwhile, a detractor (0-6) should be encouraged to share their frustrations with a question like, “What issue did you face that led to your rating?”.
This segmentation ensures that each customer type provides feedback that is relevant and actionable, allowing businesses to pinpoint areas for improvement while also reinforcing their strengths.
4. Avoid Bias & Common Survey Design Mistakes
Even a well-structured NPS survey can fail to provide useful insights if it contains bias or design flaws. One of the most common issues is overcomplicating the survey with too many questions, which discourages participation. When customers feel like a survey is taking too long, they may either abandon it or rush through it, leading to incomplete or inaccurate responses.
Another mistake is forcing respondents to answer every question, which can lead to survey fatigue and low-quality feedback. Instead, surveys should allow users to skip questions if they don’t have a strong opinion, ensuring that responses are genuine rather than forced.
Additionally, surveys should always provide a balanced range of response options. If a company only offers positive choices without a neutral or negative option, the data becomes skewed and unreliable. Similarly, businesses must ensure that their follow-up questions are not too vague, as unclear questions result in unhelpful responses.
Choose the Right Timing for NPS Surveys
The success of an NPS survey is not just about what questions are asked, but also when they are sent. Timing plays a crucial role in response rates and data accuracy, as surveys sent too soon may not capture a customer’s full experience, while those sent too late may result in lower engagement or forgotten details.
The Best Times to Send an NPS Survey
For an NPS survey to be effective, businesses must ensure that customers have had enough time to form an opinion. However, this varies by industry, customer journey, and product/service type.
- For eCommerce and Retail: The best time to send an NPS survey is shortly after delivery or product use. Customers should have enough time to experience the product but not so much that they forget details. Sending a survey 24-48 hours after delivery ensures feedback is fresh.
- For SaaS and Subscription Services: Timing depends on the length of the free trial or onboarding process. An NPS survey should be sent after users have had sufficient hands-on experience, often 30 days after sign-up. This allows them to explore the product before forming an opinion.
- For Hospitality and Travel: The best time to send an NPS survey is immediately after check-out or completion of service. For example, airlines should request feedback after the flight, and hotels should follow up upon check-out.
- For B2B Services: Since customer relationships in B2B are long-term, NPS surveys should be sent at strategic points such as after onboarding, quarterly reviews, or after contract renewal.
Automate NPS Surveys After Key Milestones
Rather than sending NPS surveys at fixed calendar intervals, businesses should use automation to trigger surveys after specific customer milestones. This ensures that feedback is gathered at the most relevant moments.
For example, in an eCommerce setting, a business can automate NPS surveys to be sent three days after delivery confirmation to capture immediate post-purchase satisfaction. For SaaS companies, a survey can be triggered once a user completes onboarding or achieves a key milestone, such as using a feature multiple times.
By automating NPS surveys, businesses can ensure that customers receive surveys at the right moments in their journey, leading to higher response rates and more insightful feedback.
NPS Survey Distribution: Best Practices for Higher Response Rates
Beyond timing, the way an NPS survey is delivered also impacts response rates and data accuracy. Customers interact with brands through multiple touchpoints, so choosing the right distribution method is essential to maximizing engagement.
NPS Survey Distribution Methods
Different survey distribution channels offer varying response rates and effectiveness depending on the business type and audience.

- Email Surveys: One of the most effective and widely used methods, email NPS surveys allow businesses to reach customers directly. Emails should be concise, mobile-friendly, and personalized to increase engagement.
- Website Pop-Ups: Triggered based on customer behavior, website pop-up surveys are ideal for gathering feedback from visitors while they are still engaged. However, they should be used sparingly to avoid disrupting the user experience.
- In-App or Product Surveys: SaaS businesses and mobile apps can integrate in-app surveys to capture feedback at the moment of interaction. These surveys often have higher response rates because they require minimal effort from users.
- SMS Surveys: Ideal for industries such as hospitality and eCommerce, SMS surveys enable businesses to reach customers directly on their mobile devices. However, messages should be short and contain a direct survey link to encourage participation.
- Chatbot Surveys: Some businesses use AI-powered chatbots to engage users in real-time and request feedback within messaging platforms. This method is particularly useful for customer support interactions.
Best Practices to Increase NPS Survey Response Rates
Maximizing NPS survey response rates requires more than just sending out a questionnaire. Customers are bombarded with emails, notifications, and surveys every day, so you must implement strategies that make their surveys stand out, feel personal, and require minimal effort to complete. Below are the most effective best practices for increasing response rates while ensuring that the data collected remains reliable and actionable.
1. Personalize Your Surveys
A generic survey request is easy to ignore, but a personalized message increases engagement and response rates. Customers are more likely to participate when they feel the request is directly relevant to them.
Personalization starts with addressing the customer by name, referencing their last purchase or interaction, and explaining why their feedback is valuable. For example, instead of a bland “We’d love your feedback”, a company could send:
“Hi [Name], we hope you’re enjoying your recent purchase of [Product Name]! Your opinion matters to us—could you take a moment to share your experience?”
By making the request feel genuine and personal, businesses can increase response rates while also strengthening customer relationships.
2. Optimize for Mobile Users
A large percentage of customers open emails, messages, and surveys on their mobile devices. If an NPS survey is not optimized for mobile, it may be difficult to complete, leading to abandonment and lower response rates.
To ensure mobile-friendliness the survey layout should be responsive and adapt seamlessly to different screen sizes, the NPS scale and open-ended fields should be easy to tap and navigate and the survey link should open instantly, without requiring unnecessary logins or page loads.
A smooth mobile experience reduces friction and makes it easier for customers to respond quickly and effortlessly.
3. Keep the Email Subject Line Clear & Concise
The subject line is the first impression of the survey request. If it’s vague, too long, or overly promotional, it may be ignored or marked as spam. The best approach is to make it short, friendly, and to the point.
Effective subject lines include:
- “Got a minute? Tell us what you think!”
- “Your feedback makes us better—share your thoughts!”
- “How was your experience? Quick 1-minute survey!”
These subject lines create a sense of urgency, highlight the survey’s brevity, and make it clear that the customer’s opinion is valued.
4. Set Expectations on Time Commitment
Customers are more likely to complete a survey if they know exactly how long it will take. A simple time estimate in the request email—such as “This will take less than a minute!”—can make a significant difference.
If a survey seems too time-consuming, customers may ignore or abandon it halfway through. Reinforcing that it’s a quick and simple process increases the likelihood of completion.
5. Send Reminders (But Not Too Many)
Many customers intend to complete surveys but forget or get distracted. A single reminder email sent 48-72 hours after the initial request can boost response rates without feeling intrusive.
However, sending too many reminders can have the opposite effect, annoying customers and increasing unsubscribe rates. A well-crafted reminder should feel helpful rather than pushy, such as:
“Hey [Name], we know life gets busy! If you have a minute, we’d love your feedback on your recent experience. Your insights help us improve!”
This keeps the request warm and engaging without overwhelming the recipient.
6. Avoid Sending NPS Surveys from a Company Account

Emails sent from a generic company account (e.g., [email protected] or [email protected]) tend to get ignored. Customers are far more likely to open and respond to emails that come from a real person’s name.
Instead of sending surveys from an impersonal address, businesses should send them from a recognizable individual, such as:
- “Sarah from [Company]”
- “Mike | Customer Experience Team at [Brand]”
This humanizes the request, makes it feel more personal, and reassures customers that their responses will be read and valued.
In my experience, the NPS surveys with the highest response rate were sent from the CEO mail. This shows that you care about what your customers think.
7. Close the Feedback Loop
One of the biggest mistakes businesses make with NPS surveys is not following up on responses. Customers want to know that their feedback is being heard and acted upon.
You could share key takeaways from NPS results with customers (e.g., “Based on your feedback, we’re improving our checkout experience!”), or personally follow up with Detractors who had a poor experience in resolving their issues.
When customers see that their feedback leads to real improvements, they are more likely to engage in future surveys.
Analyze & Act on NPS Responses
Collecting Net Promoter Score (NPS) data is only the first step in improving customer experience. The real value lies in how businesses analyze, interpret, and act on the feedback. A well-structured approach to NPS analysis allows companies to pinpoint areas for improvement, enhance customer relationships, and drive business growth.
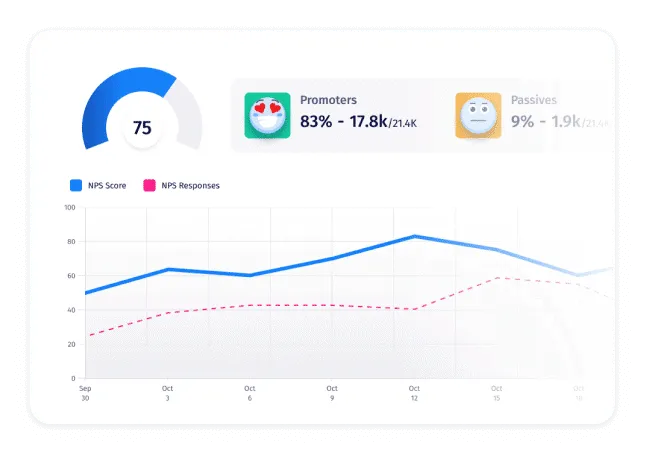
1. Categorize Feedback: Promoters, Passives, and Detractors

The first step in analyzing NPS results is segmenting customers based on their responses:
- Promoters (9-10): These are loyal customers who actively advocate for your brand. They are more likely to repurchase, leave positive reviews, and refer new customers. Businesses should focus on leveraging their enthusiasm through referral programs and exclusive perks.
- Passives (7-8): This group is generally satisfied but lacks strong loyalty. They could be easily swayed by competitors, meaning businesses must engage with them proactively to enhance their experience and turn them into promoters.
- Detractors (0-6): These customers are unsatisfied and may share negative feedback publicly, damaging brand reputation. Identifying their pain points and addressing concerns as soon as possible is crucial to preventing churn and improving overall satisfaction.
By categorizing responses, businesses gain a clearer picture of customer sentiment, allowing them to tailor their follow-up strategies accordingly.
2. Identify Key Themes in Open-Ended Responses
The most valuable insights often come from the open-ended follow-up questions included in the NPS survey. These responses reveal the why behind the score and provide actionable details about customer pain points, expectations, and experiences.
To extract meaningful insights:
- Group Similar Feedback into Categories: Identify common themes across responsess. For example, if multiple detractors mention “slow customer support,” this signals an area requiring improvement.
- Use Text Analysis Tools: AI-powered tools or Natural Language Processing (NLP) can help detect sentiment trends, frequently used words, and recurring issues in large data sets.
- Focus on Actionable Insights: Not all feedback will be relevant. Prioritize recurring problems and impactful suggestions that can drive meaningful change.
By identifying key themes, businesses can understand the root causes of customer dissatisfaction and prioritize enhancements that will have the greatest impact.
Practical Tips for Effective NPS Data Analysis
Extracting meaningful insights from NPS responses requires more than just calculating a score—it involves a structured approach to analysis that highlights key trends, customer pain points, and opportunities for improvement. Below are 4 essential best practices for making NPS data actionable.
1. Track NPS Trends Over Time for Deeper Insights
A single NPS snapshot offers a momentary view of customer sentiment, but tracking changes over time reveals patterns and trends that help businesses identify what’s working and what needs improvement.
Instead of treating NPS as a one-time evaluation, you should implement regular tracking, such as monthly or quarterly NPS tracking to assess seasonal trends or the impact of new initiatives or year-over-year comparisons to gauge long-term customer satisfaction improvements.
By monitoring these shifts, businesses can correlate NPS fluctuations with specific actions—such as pricing adjustments, feature launches, or customer service improvements—allowing them to make data-backed strategic decisions.
2. Segment Responses to Identify Key Customer Patterns
Not all customers experience a product or service in the same way. Segmenting NPS data based on different customer attributes can reveal variations in satisfaction across distinct user groups.
Key segmentation approaches can include:

For example, if long-term subscribers give a lower NPS than new customers, this could indicate issues with customer retention and long-term value delivery. Understanding these patterns helps businesses personalize retention strategies and tailor improvements to specific customer groups.
3. Prioritize High-Impact Issues for Immediate Action
NPS surveys often generate a large volume of feedback, but not all insights have the same level of urgency. You should focus on identifying and addressing the most critical issues that impact customer retention, revenue, and brand perception.
To prioritize effectively:
- Identify common themes across detractor feedback. If a significant number of customers cite slow response times in customer support, that becomes a high-priority issue.
- Assess the business impact of complaints. Negative feedback about a minor UI inconvenience may not be as urgent as complaints about checkout failures or billing errors.
- Quantify the risk of churn. If a high percentage of detractors indicate they are likely to leave, focusing on retention strategies should be a top priority.
By narrowing the focus to high-impact improvements, businesses can allocate resources more effectively and resolve the most pressing concerns first.
4. Benchmark Against Industry Standards to Gain Context
Understanding how your NPS compares to industry benchmarks is essential for determining whether your score is truly strong or in need of significant improvement. A score of +50 may seem impressive, but if competitors in the same industry consistently score +70 or higher, there is room for improvement.
To effectively benchmark NPS compare scores against direct competitors to understand relative market positioning, evaluate industry-wide benchmarks from reports and market research firms to set realistic goals, and also assess trends over time to see if you are closing the gap with top industry performers.
Here is the average NPS score by industry for eCommerce:
| Industry | Average NPS Score | Top Performers |
|---|---|---|
| Beauty & Wellness | 30-50 | 60+ (Luxury & organic brands) |
| Apparel & Fashion | 25-45 | 55+ (High-end or niche brands) |
| Furniture & Home Goods | 20-40 | 50+ (Premium & customizable products) |
| Consumer Electronics & Tech | 30-50 | 60+ (Apple, Samsung, premium tech brands) |
| Food & Beverage | 35-55 | 65+ (High-end or personalized food brands) |
Industry-Specific NPS Survey Best Practices
Each industry has unique customer expectations and challenges that impact NPS scores. Here’s a detailed breakdown of how different eCommerce sectors perform:
Beauty & Wellness (Average NPS: 30-50, Top Performers: 60+)
Beauty & wellness brands often see strong customer loyalty due to personalization, ingredient transparency, and brand identity.
- Luxury and organic brands (e.g., Sephora, Glossier) often exceed an NPS of 60+, leveraging VIP memberships, exclusive products, and seamless omnichannel experiences.
- Brands with subscription models (e.g., Birchbox) also perform well, benefiting from repeat customers and high engagement rates.
Apparel & Fashion (Average NPS: 25-45, Top Performers: 55+)
Fashion brands struggle with returns, inconsistent sizing, and fast-changing trends, making it difficult to maintain high NPS scores.
- Premium and niche brands (e.g., Lululemon, Patagonia) tend to score above 55, thanks to ethical sourcing, quality materials, and exceptional customer service.
- Fast-fashion retailers typically have lower NPS scores, as they often face criticism over sustainability and product quality.
Furniture & Home Goods (Average NPS: 20-40, Top Performers: 50+)
Furniture brands typically have lower NPS scores due to long shipping times, complex assembly, and costly returns.
- Brands that offer customization, white-glove delivery, or augmented reality shopping experiences (e.g., Wayfair, IKEA with its AR app) see higher NPS scores.
- Companies that proactively communicate delivery timelines and offer hassle-free returns tend to retain customers better.
Consumer Electronics & Tech (Average NPS: 30-50, Top Performers: 60+)
Tech brands see higher loyalty when products are user-friendly, reliable, and backed by strong customer support.
- Apple, Samsung, and Tesla consistently achieve NPS scores of 60+, driven by innovation, seamless ecosystem integration, and brand reputation.
- Lower-performing brands often struggle with customer service delays, software bugs, and confusing user interfaces.
Food & Beverage (Average NPS: 35-55, Top Performers: 65+)
Food brands that prioritize quality, convenience, and sustainability tend to perform well in NPS rankings.
- Meal delivery services and organic food brands (e.g., HelloFresh, Whole Foods) often achieve 65+ NPS, thanks to freshness guarantees, sustainable sourcing, and fast delivery.
- Grocery delivery services with unpredictable stock availability or slow delivery times typically score lower.
To Wrap Things Up
Effectively utilizing Net Promoter Score (NPS) surveys requires more than just collecting scores—it’s about gathering actionable insights, engaging customers, and driving continuous improvement.
By structuring surveys correctly, and choosing the right timing, you can increase response rates, improve data quality, and make more informed decisions. Additionally, closing the feedback loop ensures that customers feel heard, enhancing their trust and loyalty.
Leveraging NPS insights strategically can lead to stronger customer relationships, higher retention rates, and long-term business growth. Whether it’s refining product offerings, improving customer support, or identifying pain points in the customer journey, a well-executed NPS strategy empowers businesses to make data-driven improvements that truly resonate with their audience.


