


Hey, there!
You’re about to find the basics of Net Promoter Score. Why read an entire guide customer satisfaction and customer loyalty.on NPS? Because it is one of the few KPIs in eCommerce that gives you a glimpse into the future. We’re happy you’re here. It means you want to use NPS in a way that is valuable for your business.
We understand.
Although there are a lot of materials around this metric, there’s also a lot of misinterpretation. So, if you want to learn the basics of NPS in eCommerce, bear with us until the end.
This NPS guide includes the most important principles and best practices we’ve gathered as a company by helping hundreds of eCommerce companies improve their customer experience and developing several eCommerce software solutions for companies like yours, including an automated NPS solution.
We’re ready to share with you all our learnings.
Grab a cup, grab a notepad, let’s start!
What is Net Promoter Score or NPS?
The Net Promoter Score (NPS) is a metric that shows how many customers are willing to recommend a product or service to others. It is one of the most important KPIs for any eCommerce business since it is a metric that offers insights into future customer behavior.
Valentin Radu, CEO at Omniconvert, captured the essence of NPS’s role in measuring customer experience:
“Check the difference in customer experience between two key moments in your customers’ journey: pre and post-delivery.
This way, you will know if your company actually respects the principle of under-promise and over-deliver and if your customer expectations are being matched by what you promised through your marketing.
If you do track the Net Promoter Score, you have to look beyond the average score and go granular by segmenting the NPS responses.
The challenge is that calculating the average Net Promoter Score removes the most interesting facts from your analysis.
Like, basically, it’s just indicative, like any average score. On average, the temperature on planet earth is 21 degrees. Not useful if you plan a trip to Alaska in bikinis, right?
Therefore, you need to know which customer segments, products, brands, cities, or strategies provide the most Promoters or the most Detractors, and the truth is that the average NPS model hides all that data.
So, before paying for an NPS tool, make sure you actually know what ROI you want to get out of it because calculating it as an average, post-purchase only, without a real strategy behind it, won’t cut it.”
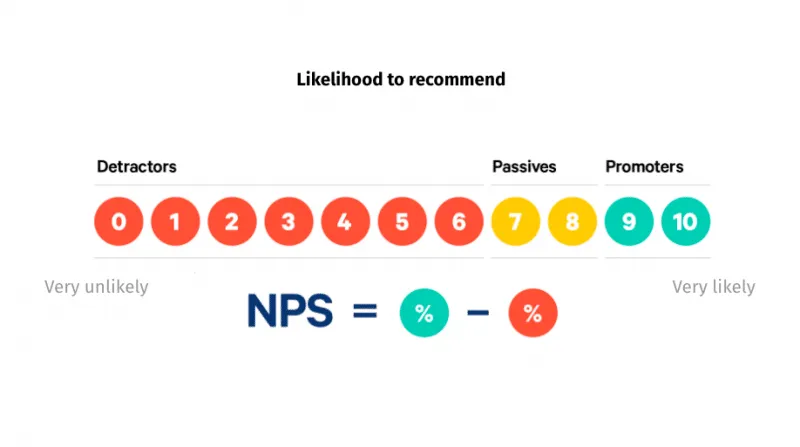
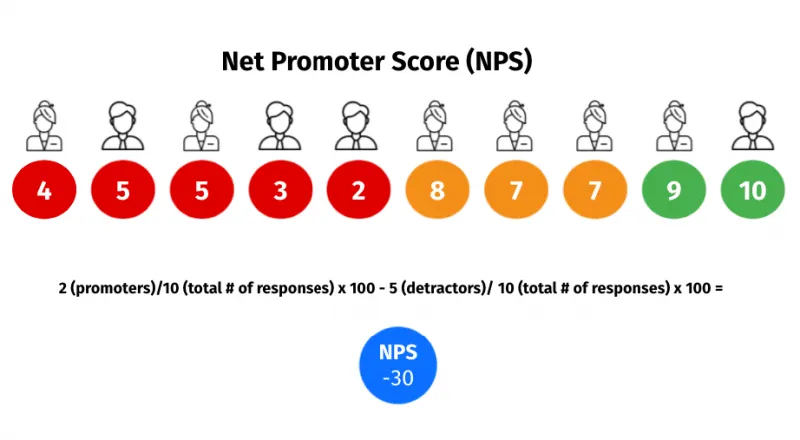
While the NPS survey questions sent by eCommerce stores vary, depending on their business model and intent, the standard scale used for NPS is from 0 to 10, where 0 is the lowest score, and 10 is the highest.
Based on the answers you receive from your customers, you can calculate NPS and identify how many promoters, passives, or detractors your company has.
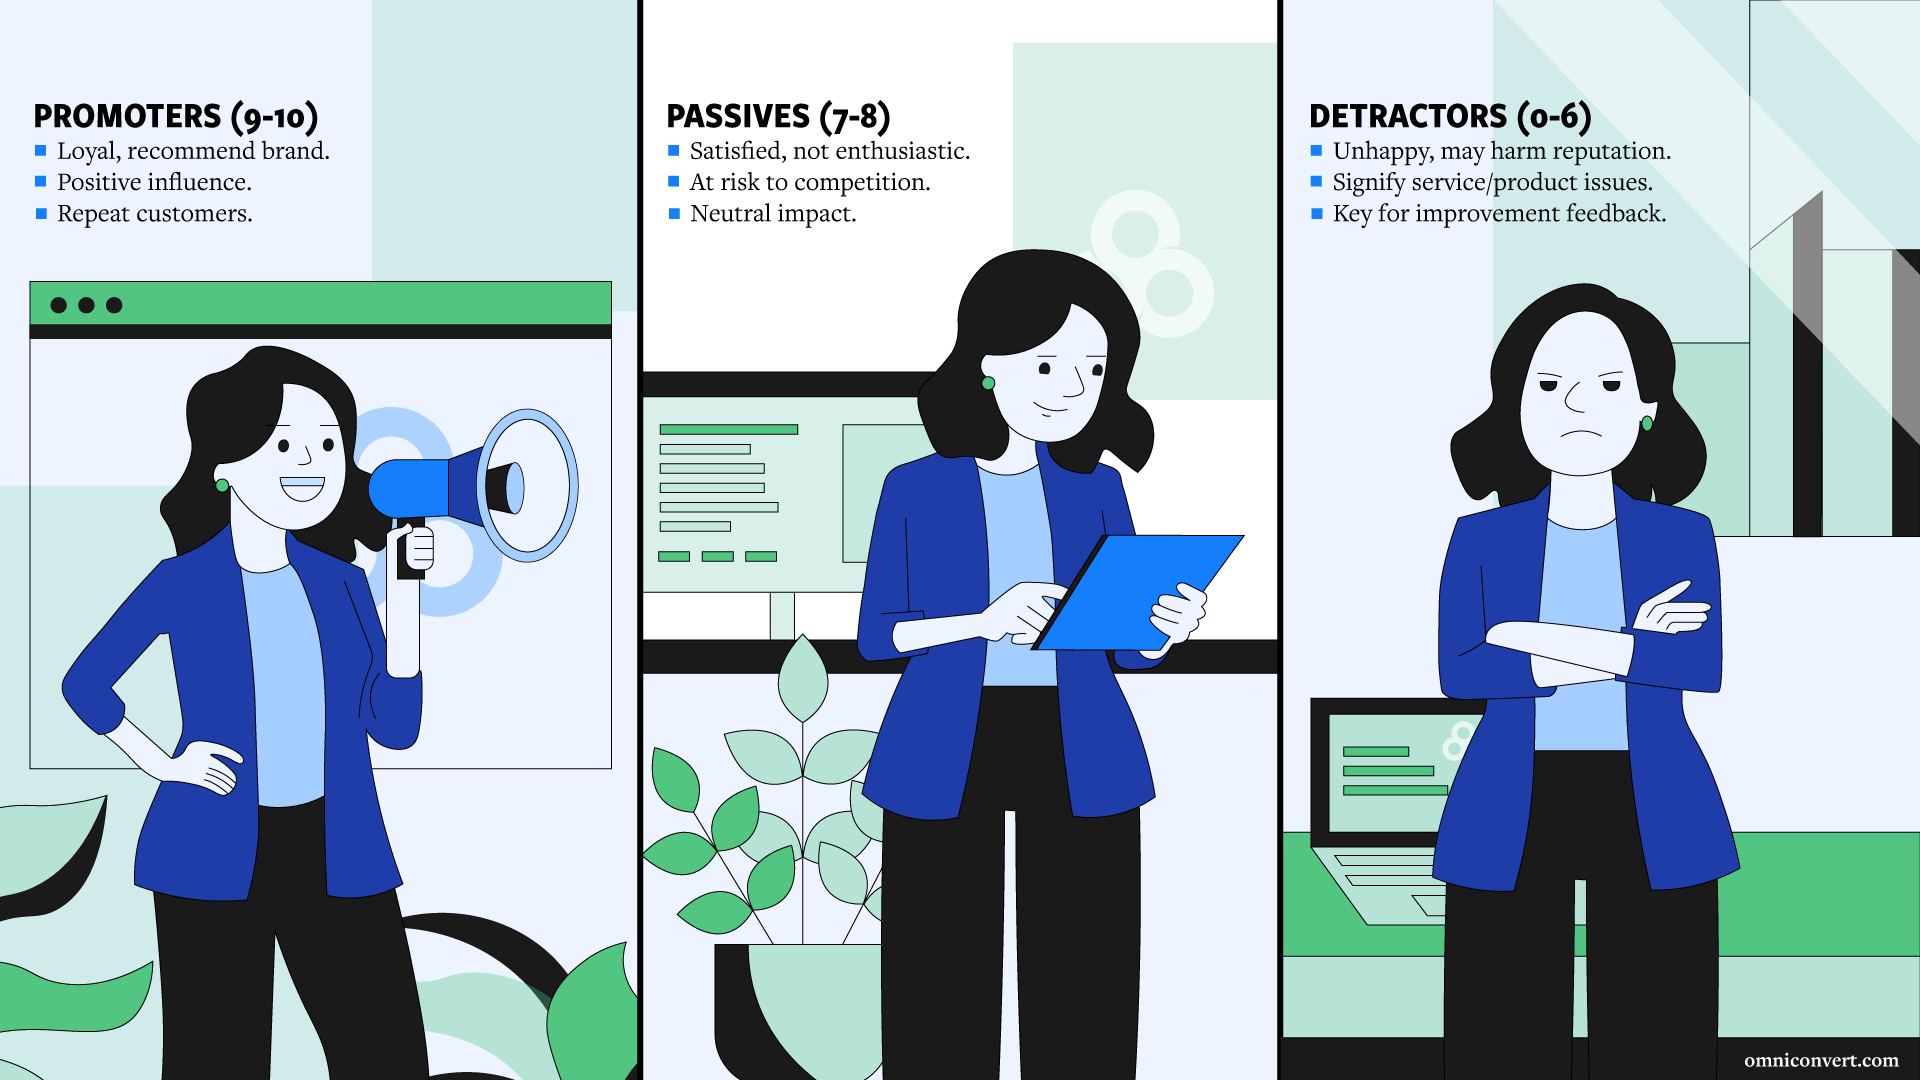
Promoters
Net Promoter Score: 9 – 10

Promoters are customers that are highly satisfied with the experience you offered. They are most likely to become brand ambassadors, helping you attract new customers to your site and offers. You want to keep them happy and loyal so that you can design special treatments for them.
Passives
Net Promoter Score: 7 – 8
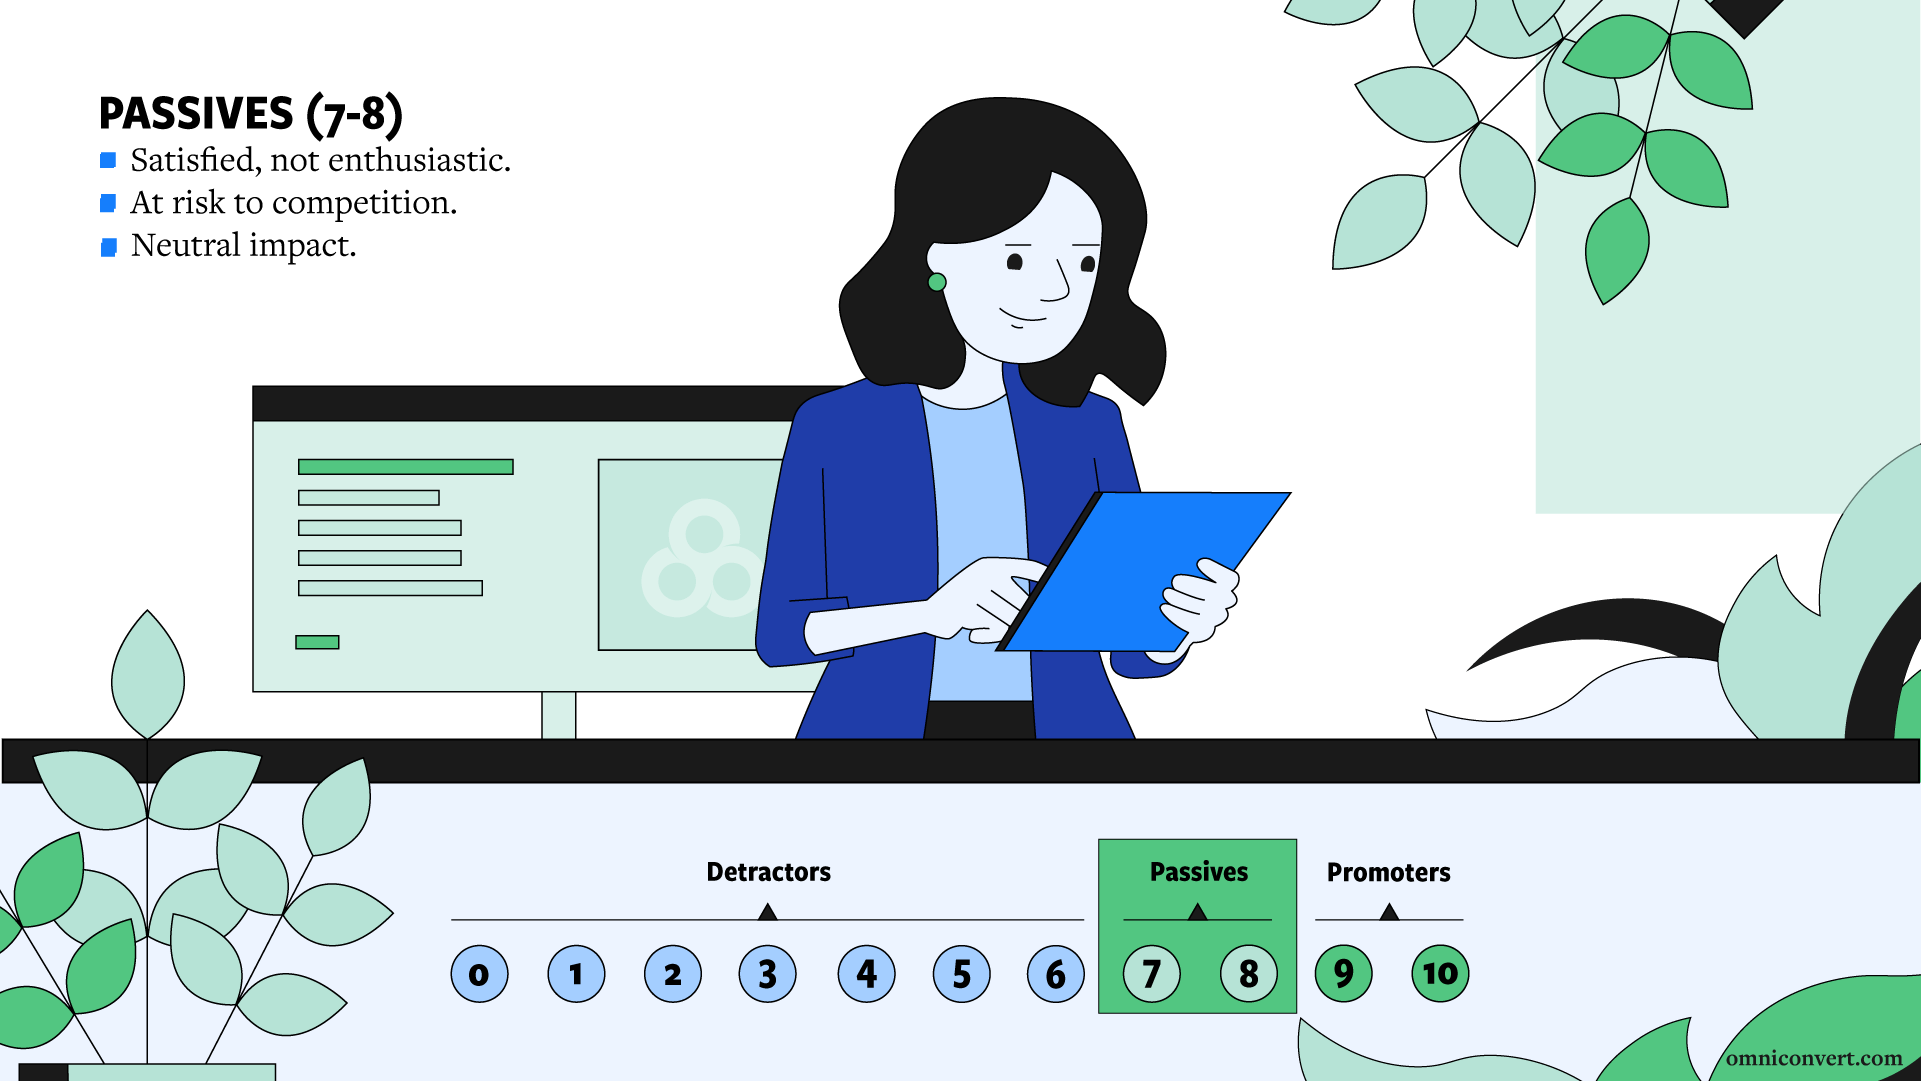
Passives are satisfied customers, but they don’t share the same enthusiasm promoters have. If you want to transform passives into promoters, you need to find what would have made them give you a higher score. If you ignore them, they might leave you for a competitor or become detractors, so pay attention to this group.
Detractors
Net Promoter Score: 0 – 6
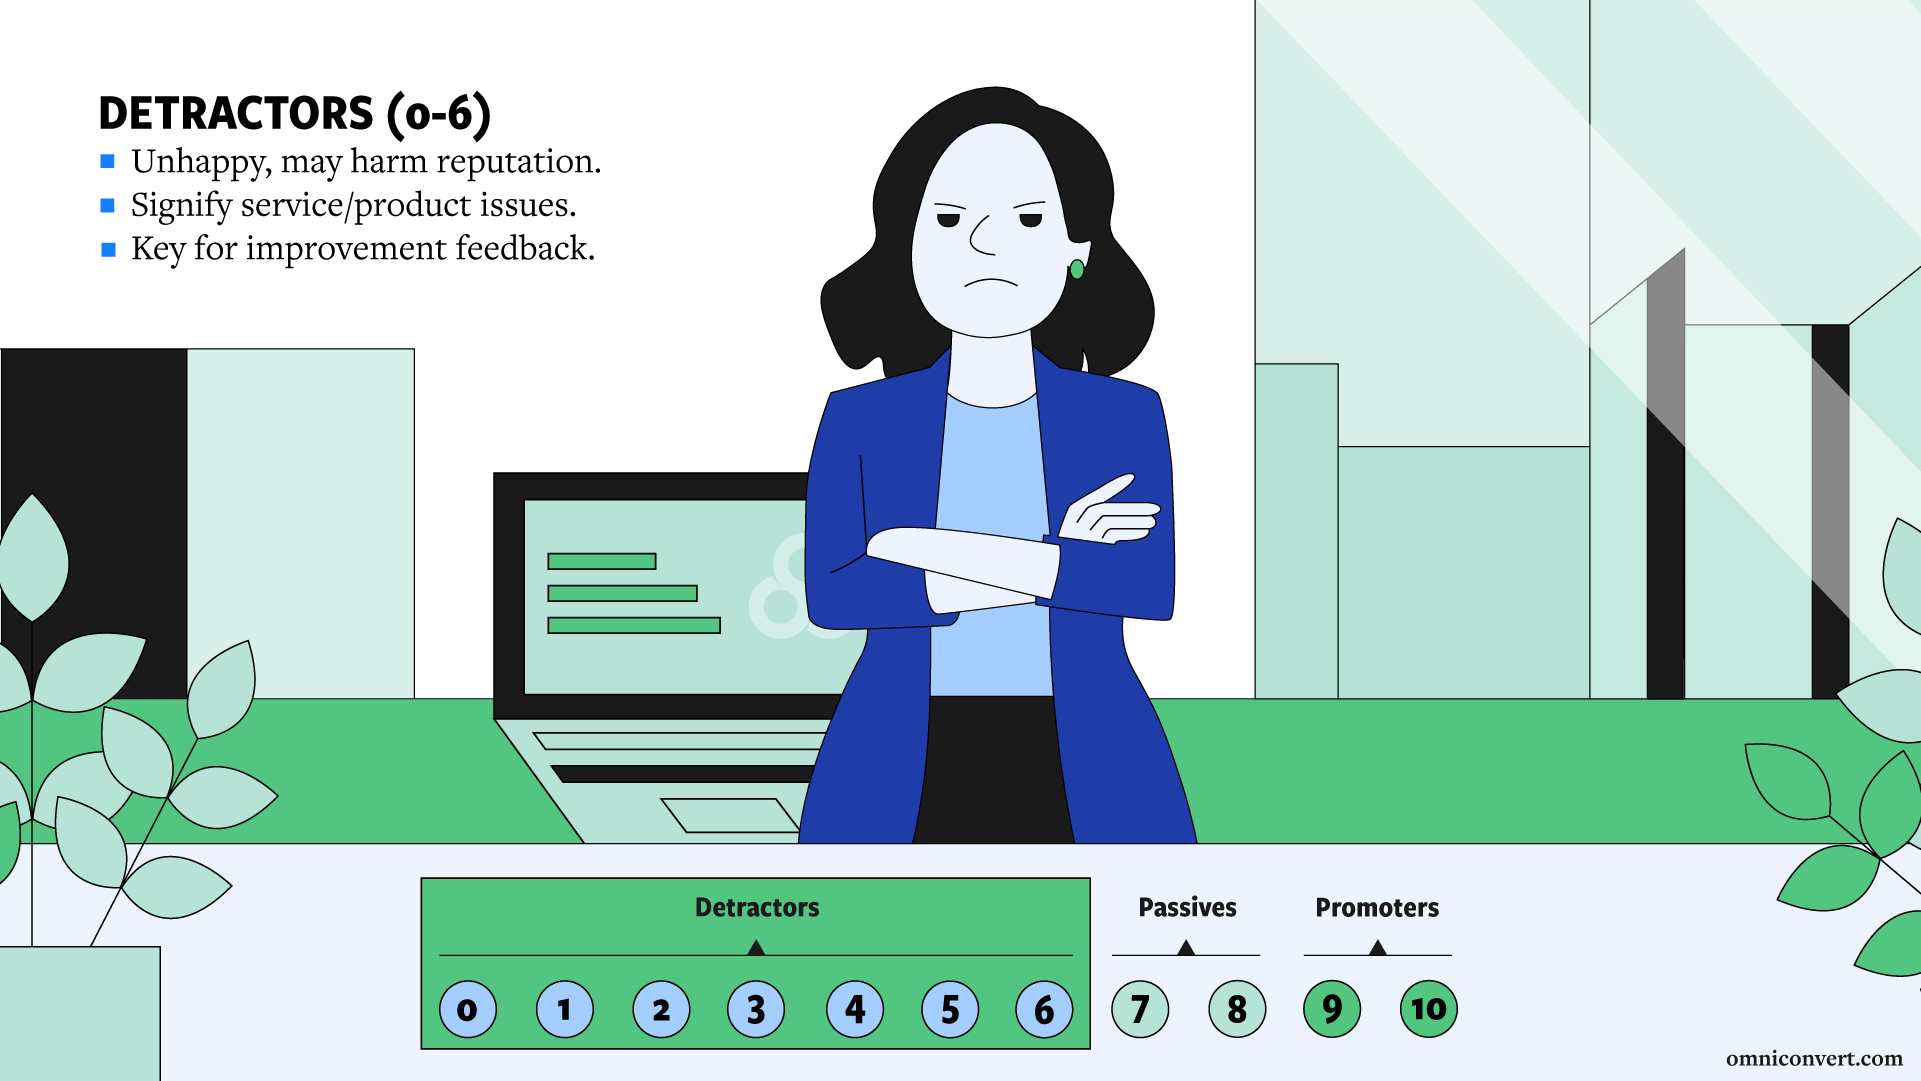
Detractors are customers that are not satisfied with the experience they received from you. Ignoring their complaints might have a negative impact on your sales and brand. You need to approach detractors carefully, find the reasons behind their poor experience and fix the problems as soon as possible.
As an eCommerce company, you need to measure NPS both pre-delivery and post-delivery if you want to capture valuable insights about the customer experience as a whole. Another important aspect you should keep in mind is that, without segmentation, NPS becomes just another KPI that makes your team even more confused about what is really going on with their customers.
We don’t want to rush into concepts, so if you want to understand NPS and use it correctly, we encourage you to read the entire guide.
How to calculate NPS?
NPS represents the difference between the percentage of Promoters and the percentage of Detractors.
The NPS is formula is:
NPS = %Promoters – %Detractors
The lowest NPS is -100, and the highest is +100. So, yes, NPS can be negative, meaning that your business has more detractors than promoters.
Some businesses use a holy spreadsheet, some use a NPS calculator and some prefer an integrated NPS tool that can be connected to their eCommerce platform and email marketing tool.
A low or negative NPS is a sign of worry for any business. It means that you are losing many customers because they are disappointed by what you offered them, and you didn’t do anything to win back their trust. A negative or low score gives you a clue regarding your decreasing revenues and retention rates.
People frequently look for an NPS benchmark or ask, “What is a good/ bad Net Promoter Score?”
It would be wrong to generalize, but any NPS score above 0 is a good score, showing that the number of promoters exceeds the number of detractors. Any negative score is bad, so stay positive.
As you will see further in this guide, average NPS is misleading and can easily become just another vanity metric to brag about in the meeting, but that’s not the point of tracking and analyzing NPS.
You’re collecting feedback via NPS surveys so you can improve the customer experiences and satisfaction based on real data from real customers, sharing their honest thoughts on what they believe about your brand and your products.
Why is Net Promoter Score important for your eCommerce business?
Net Promoter Score is one of the most important KPIs for an eCommerce business because it predicts future customer behavior. The higher the NPS score, the higher the chances your customers will recommend your company to others.
By measuring and monitoring NPS, you are always aware of your priorities and what you need to improve customer loyalty. Keeping your existing customers happy and loyal comes first. If they are happy, they become promoters, attracting more people to your business.
We can’t talk about the importance of NPS without mentioning Fred Reichheld, the creator of the Net Promoter Score and one of the greatest promoters of customer loyalty as a source of growth.
In an article written for Harvard Business Review in 2003, Fred Reichheld defined NPS as “the one number you need to grow.” Two decades later, two-thirds of Fortune 1000 companies use NPS to measure customer satisfaction and loyalty.
For years, Reichheld had been “focused on loyalty and treating people right.” He found that “companies that focus on earning the loyalty of customers are taking over the world.” They make higher profits, pay employees more, keep employees longer, reward investors better – a virtuous circle.
Reichheld created NPS for leaders that needed a simple metric to find the answer to this question: “Are we winning or losing with our customers?” He said that NPS “is a bottom-line number you can focus on and know when it’s time to drill down into detractors, passives, promoters, root causes.”
Does your eCommerce heart skip a beat every time you hear NPS, CLV, RFM, CAC, and all customer-related things?
We think you might like to listen to this podcast episode, where Jason Greenwood, an expert with 20+ years of experience in eCommerce, and his guest, Juliana Jackson, talk about what online stores can do to serve their customers better.
Three principles you must know before you start monitoring NPS
Before we get to the part where we’re talking about how you can monitor Net Promoter Score, three principles prevent you from making decisions based on misleading NPS. Apply these principles and they’ll enable you to use NPS as a metric that helps you improve customer satisfaction and experiences.
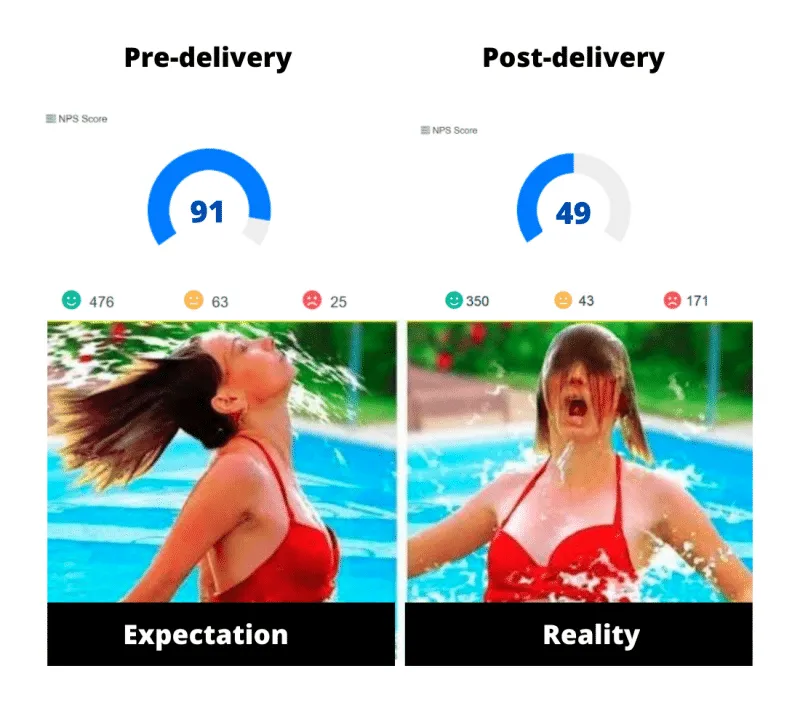
1. Mind the gap: pre-delivery NPS versus post-delivery NPS
Most companies measure the NPS only after an order is delivered.
But if you want to get better insights from your customers about their experience with your store, you need to measure and calculate the NPS at two key moments: before and after delivery.
This way, you will know if your company actually respects the “under-promise, over-deliver” principle. Without this extra set of customer intelligence analytics, the NPS in itself is an average number that lacks the actionable aspect, like so many other over-hyped and underused metrics.
At Omniconvert, we monitor what happens before delivery by measuring pre-delivery NPS and what happens after delivery once the customer starts using the ordered products by measuring post-delivery NPS.
The difference between pre-delivery and post-delivery NPS is called “The Delivery Gap” and you can calculate it like this:
Pre-Delivery NPS – Post-Delivery NPS = Delta NPS
Let’s look at the example below. In this case, we see a big delivery gap caused by the fact that the post-delivery NPS is way lower than the pre-delivery NPS. It means that the store promises more than it delivers. You can usually see this huge gap at the first order, as the newly acquired customers don’t buy the product itself, but the marketing around the product.
2. Treat the objections in real-time, not after one quarter. Or worse, never.
In such a fast-paced commercial environment, typically customers expect to solve their problems instantly. They don’t want to be called 2-3 days after an incident or, even worse, to be completely ignored.
Most companies monitor NPS with the help of external providers, who send questionnaires to the customers, and then…nothing happens! That’s not a healthy approach.
You need to take action in real-time because NPS is one of the few metrics that show your store’s future. While revenue and all of the financial KPIs show you the past (and there’s nothing you can change about the past), NPS can help you change the present actions and achieve better goals.
To help you know when to act and how to act, we’ve created a blueprint for monitoring and using the Net Promoter Score. You can download the full resolution here.

As you can see, our proposed methodology covers both pre-delivery and post-delivery NPS. You have different suggested scenarios based on the score you received from your customer and also on the customer segment (in our blueprint, it refers to RFM segments – a concept that you’ll find explained below, in this guide, in the “NPS by RFM segments” section).
Only when you manage to collect NPS data and act in real-time can you deflate the ticking bombs signaled by your unhappy customers, those whose expectations you haven’t met.
NPS is related to word-of-mouth, customer retention rate, and customer lifetime value. If you measure it correctly and act upon it based on a clear method, your company will thrive in any conditions because your loyal & happy customers will save it.
3. Look beyond the average: segment NPS responses
Average values are misleading. This also applies to our case because NPS measures satisfaction among different groups of customers with different buying behaviors, who purchased from various cities, ordered different products, and so on.
Measuring the average Net Promoter Score only removes the most interesting facts from our analysis. The reliable approach to NPS is to drill down for a comprehensive image of what customers think.
So, to find the truth behind the scores obtained by collecting customer feedback via your NPS surveys and make data-driven decisions, you need to look at NPS from different angles:
- Pre-delivery NPS versus post-delivery NPS
- NPS by RFM segment
- NPS by Location
- NPS by Brand
- NPS by Category
- NPS by Channel
Make sure you use the right tools that allow you to segment the NPS responses and know exactly which customer segments, brands, cities, or commercial tactics provide the most Promoters or the most Detractors.
Analyzing NPS from different angles
NPS is more than a metric added to your list of KPIs, it’s a source of insights for the whole company.
Measuring and monitoring NPS by taking into account different variables allows you to identify exactly what causes a negative or a positive customer experience.
Is there a valuable segment that is unhappy with what you delivered? Is there a brand that is dragging down your score? Do you receive lower scores from a particular city? Do you have a category that causes more problems than others?
Here’s how you can find answers to these questions by looking at NPS from different angles.
Pre-delivery and post-delivery NPS
As we mentioned earlier, there are two key moments when you should measure customer satisfaction and loyalty: before and after delivery.
In our tool, REVEAL, these two pivotal moments are measured by two metrics: the pre-delivery NPS and the post-delivery NPS. To identify if there’s a gap between these two phases, you need to measure both:
Pre-delivery NPS – asking your customers about their experience on your website and in the check-out process (what happens before delivery);
Post-delivery NPS – asking about their experience with the products they ordered (what happens after delivery once the customer starts using the ordered products).
Measuring your Net Promoter Score in these two essential moments helps you identify what generates satisfaction or dissatisfaction for your customers. Based on their feedback, you’ll know where you need to focus your efforts to improve customer experience:
- A low pre-delivery NPS reveals that you need to improve the online experience;
- A low post-delivery NPS shows that what the customers receive is below what you promised to deliver.
The pre and post-delivery scores below belong to a fashion store. By measuring NPS in both key moments, the company was able to identify, based on customer feedback, why they deal with such a high churn rate.
Besides the long delivery times (the company was already aware of), customers were disappointed by the received product quality. There was a large discrepancy between the quality displayed on the site and that of the products received.


NPS by RFM segment
Not all customers are created equally. So how do you identify which customers are more valuable to your business?
One of the most reliable ways to identify valuable customers is through RFM segmentation and analysis. Let’s define these concepts.
RFM analysis (Recency, Frequency, Monetary values analysis) reveals data anomalies that allow you to discover the most important groups of customers when you balance the customer acquisition cost with the margins they generate.
RFM segmentation identifies the most important types of customers by grouping them according to their RFM score. This method allows you to target specific customer clusters more appropriately to their particular behavior, thus generating higher rates of response, increased loyalty, and improved customer lifetime value.
The main benefits of monitoring NPS by RFM segments are:
- Your customer service resources can be allocated according to customer value: better customer relations with the customers that matter;
- You can craft loyalty programs and deliver unique experiences that take into account the voice of the most important customers and allow you to improve customer retention;
- You can improve Customer Lifetime Value, avoid churn, increase both customer satisfaction and customer loyalty.
As Juliana Jackson said, mixing NPS with RFM segments helps you focus your efforts on your top customers:
“In eCommerce, the customer support team deals with a considerable volume of customers and tickets every day, and sometimes, it becomes harder to prioritize amongst customers.
I mean, let’s face it. Not all of the customers are made out of honey, and funny enough, the ones that are bringing the lowest value to a brand are the most demanding, and they are adding up the most to the Cost of Service.
Using a mix of transactional data from RFM and real-time NPS responses, you can send your most valuable customers to your support team and help them prioritize work based on the customer’s value and their satisfaction with your brand.
By doing this, your CS team can prioritize how they solve your customers’ issues and save you revenue and obviously, increase lifetime value and customer satisfaction.
Plus, you can also identify anomalies with your products, shopping experience, delivery, and services.
This will help you make better decisions, and well you will know what to fix.
We love to combine Reveal with Gorgias for our users.”

We call the group with the highest RFM score “Soulmates” – your most loyal and valuable customers. This segment generates a significant part of your revenue and margin. You don’t want to let this segment down, as they are the main reason for your company’s growth.
Here’s proof that looking only at the average Net Promoter Score is misleading.
Take a look at December 2020, for example. The average NPS was 63.89, while the NPS score for the Soulmates group was even lower, at 53.85. There’s a significant drop from 77 in November and 100 in October. If this were your store’s score for post-delivery experience, you would want to find the root of dissatisfaction among your most valuable customer.


Monitoring NPS by RFM groups lets you act in real-time when problems arise so you can keep your most valuable customers happy and loyal in the long run.
NPS by brand/ product/ category
Sometimes your best products can become your worst. Think about the following scenario.
Part of your differentiation strategy is to introduce new brands into your product range to increase variety. As hoped for, the customers receive a new brand well enough, and it becomes a best-seller. Maybe the prices are attractive, or perhaps the images are appealing, and different people are persuaded to purchase products from that brand.
However, what if, after purchasing that brand, the same buyers are disappointed and will never return to your shop to purchase anything else ever again?
NPS is a score that is directly correlated with future purchase intent. Measuring your NPS pre and post-delivery by product, brand, or category helps you see if there’s a marketing problem (you overpromised) or an issue with specific items that you sell. By monitoring this metric, you prevent customer churn, improve your product assortment and adjust your marketing campaigns.
The store in the example below received the maximum post-delivery NPS for two categories, brown and black jackets, which means that customers are happy with the products in these categories. Who are the customers that order these items? Are they top customers? What’s the margin generated? Suppose numbers look good and high-value customers order the products. In that case, the marketing team can create a new campaign around these popular categories, aiming for more orders and more happy customers.

Sometimes, particular products, brands, or categories look good in terms of revenue, but the customers don’t even bother to return them, choosing to never buy from your store again.
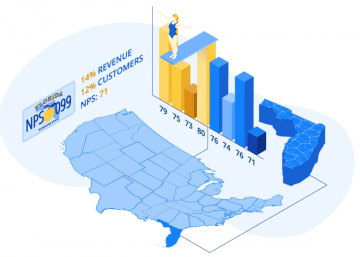
NPS by location
If you have customers across different states, regions, or countries, monitoring NPS by location helps you track how customer satisfaction is influenced by the delivery times.
In the example below, the customers in Texas and Pennsylvania have the lowest scores for NPS by location. Let’s say a high percentage of the most valuable customers of the stores are located in these two states. Then, the store’s management should prioritize delivery improvement for these two areas.

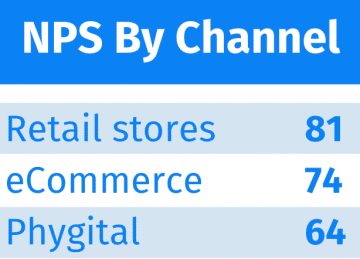
NPS by channel
Gone are the days were going only to the retail stores. Customers are now omnichannel.
Now they are researching online and purchasing offline. That’s why you want to monitor the NPS by channel and compare the scores your company receives.
In the example below, the NPS for the phygital customers is lower than the score given by those who purchase only online. At the same time, the customers that purchase only from physical stores have the highest NPS. What causes this gap between the channels? Looking for answers in your customers’ feedback will allow you to create a seamless omnichannel experience.
Examples of questions for the NPS survey
NPS surveys help you perform both quantitative and qualitative research.
Most of the companies address the classical, textbook version NPS survey question:
“On a scale from 1 to 10, how likely are you to recommend our product/ company to your friends and family?”
This question covers the quantitative side of customer feedback captured via NPS. But if you want to collect qualitative data too, you need to add some open-ended follow-up questions that allow customers to write an answer in their own words.
Ideally, the follow-up question varies per group because, based on the score you received from a customer, you will know if they are detractors, passives, or promoters.
Here are some examples of follow-up questions:
- For detractors: “We’re sorry you didn’t have the experience you’ve been expecting. What exactly did we do wrong?”
- For passives: “What could we do to offer you an even better experience?”
- For promoters: “We’re glad you’re happy with the experience we’ve prepared for you. What is it you valued most in your experience with our store?”
The good news is that customers usually say what needs to be improved no matter if they rated 1 or 10. So these follow-up questions are the perfect way to collect customer feedback.
The golden rule for NPS in eCommerce is: Always measure NPS pre-delivery and post-delivery!
The right NPS survey questions are great to avoid buyer’s remorse, as Jonathan Ivanco, Co-Founder at Formtoro, said:
“As soon as a purchase is made, there is a doubt that sets in. Invariably, the first thought a person has is, ‘Did I make the right decision? Is this product going to be worth it?’
Post-purchase, pre-delivery requires appropriate data collection that reinforces the notion that the customer made the right decision. Rather than asking about where they found you, ask about what they are most looking forward to in their purchase, be creative, lean into reaffirming the purchase.
Then follow up with the customer to ensure their expectations were met. Finish the customer journey and fill in the breaks where doubt can set in.“
In eCommerce, that first classic quantitative question would only measure the customer sentiment post-purchase or delivery, giving us an incomplete image of how they feel about the entire customer experience.
This metric becomes a powerful tool for your eCommerce business only if you measure NPS before and after delivery.
Let’s say a woman needs a dress to wear at her best friend’s wedding and buys that item from an online clothing store.
The store could adapt the NPS question and send her two surveys:
- For the pre-delivery: “How confident are you that the dress is going to fit you?”
- For the post-delivery: “How did the dress fit you?”
The first question measures the woman’s sentiment based on her experience on the website and the expectations you’ve created.
The second question helps you find if the experience and product you promised in the pre-delivery stage are good or better than what the woman received.
Depending on her answer, you can also send her follow-up qualitative questions that give you more clarity about the score she gave you.
Adapt any NPS survey template and use NPS in a way that makes sense for your business. Be creative, don’t use it like everyone else is using it. Think about the main questions that fit your business model, the products you are selling, and ask them pre & post-delivery.
Wrap up

Net Promoter Score is one of the most important KPIs in eCommerce, a simple yet powerful tool that companies like yours use to measure, monitor, analyze and take actions based on the feedback they collect via NPS surveys.
Here are some key takeaways from this NPS guide:
- NPS is one of the most important KPIs you can track because it offers insights into future customer intent.
- The standard scale used for NPS is from 0 to 10, but the NPS survey questions may vary from one store to another, depending on their business model.
- NPS generates three types of customers: promoters (highly satisfied), passives (satisfied but without the enthusiasm of a promoter), and detractors (unhappy customers that complain about their experience).
- The formula for the Net Promoter Score is the percentage of promoters minus the percentage of detractors. A negative score shows that your detractors outnumber your promoters.
- NPS is important for your business because it allows you to measure and monitor customer sentiment, and improve customer experiences and loyalty based on the gathered insights.
- There are three principles you should follow if you want to use NPS correctly: 1 – always measure NPS pre and post-delivery; 2 – objections should be treated in real-time; 3 – look beyond the average NPS and get clarity by measuring NPS from different angles, especially by RFM segments.
- If you want to receive feedback for the whole customer experience, you need to measure NPS pre and post-delivery. You can get different scores as they mark two distinct moments.
- Tracking NPS by RFM segments helps you prioritize customer support efforts, craft better experiences for your most valuable customers, leading to improved CLV, decreased churn rate, increased customer satisfaction.
- Analyzing NPS by brand/ product/ category helps you see beyond the revenue each item brings and understand why some products are more successful while others only cause you problems and generate churn.
- Looking at NPS by location helps you know if there’s something that can be improved in terms of delivery for your customers across different regions.
- NPS by channel tells you if you managed to create a seamless omnichannel experience or not and is the starting point for in-depth research on what causes the gap between experiences that take place online and offline.
- You should make the most out of your NPS survey and send qualitative follow-up questions after the standard quantitative question that measures the likelihood of recommending.
Although the net promoter score is a great way to monitor customer experience, in order to assess growth, you need to take the next step.
In the new-experience economy, customer experience matters more than price, more than products, and, indeed, more than pretty much anything.
The loyal customers are the ones who bring repeated and predictive revenue to your shop. However, as our research has shown repeatedly, very few eCommerce companies actually measure and design tailored customer experiences for their loyal customers.
Instead, companies are trapped in the acquisition mantra, bringing in new cohorts of buyers that can give eCommerce management the impression of ‘growth’. However, if these new customers are not nurtured properly, they will feel this and churn after the first purchase.
Regardless of field or channel, customer experience comes down to how a customer perceives your brand based on their interaction with it across the customer lifecycle. It’s all about the sum of micro-experiences and a continual communication flow between your customer and your business. This includes pre-purchase and post-sale impressions and encompasses both online and offline experiences.
How was it? Do you have any questions for us?
We have one!
PS: On a scale from 0 to 10, what is the likelihood of recommending this NPS guide to a colleague, peer, nephew, or boss?