


By now, you’ve done all the hard work. You’ve dug through your quantitative data and interviewed hundreds of customers to understand their needs better. Based on this, you might have even come up with a few ideas on how to fix your problems.
Now comes the fun part where you get to test out these ideas and see actual improvements in your conversion rate.
For this, you need to follow a framework. Since most of your tests will be simple split tests (i.e. A/B tests), a simple A/B testing framework will help you run more efficient and effective tests.
In this chapter, we’ll show you how the A/B testing framework works and how you can use it.
Why the A/B Testing Framework?
When it comes to CRO, it is important to design a testing framework and work systematically. A structured approach towards testing will provide statistically significant results which you can be confident in when making changes.
There are two things you must understand here:
- CRO is a scientific process. That is, you first identify problems (such as poor CTR on a button) then you come up with hypothetical solutions to solve it. A successful test doesn’t merely assume things; it always tests them out.
- CRO is a continuous process. There is no “final” form of a page; in an ideal world, you would be continuously testing variants to push your conversion rates as high as possible.
Since CRO is both scientific and continuous, you’ll be constantly shuffling through cycles of data collection, brainstorming and actual testing. A tried and tested framework will help you organize and understand your results far better.

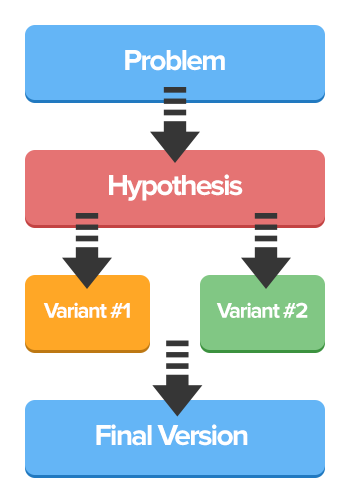
To create an A/B test, you should follow a framework. The A/B testing framework can be broken into four discrete stages:
- Identifying problems based on business, marketing or conversion goals.
- Developing hypotheses from collected data (qualitative and quantitative) to solve these problems.
- Creating and testing page variants based on the above hypothesis.
- Implementing changes based on the results of the A/B test.
Here is a simple graphic outlining the process
Let’s look at each of these stages in more detail.
Stage #1: Identifying Problems
The first step in your testing framework should be to figure out what you want to test and why.
For this, you need to define your:
- Business Objectives: Define the target metric you want to focus on. Perhaps, you want to increase sales, grow the number of users, or increase page views. This will depend entirely on the kind of business you run and what stage it’s in. For instance, a media company might focus on increasing page views while a new startup might sacrifice profitability for user growth.
- Website Goals: Defining your website goals involves prioritizing elements that are likely to lead to your business objective. For example, this could be wanting to reduce cart abandonment or adding better product images to drive sales.
- Key Performance Indicator(s): Your KPI is a measurable metric that you can use to monitor the progress of your objective. For instance, if your business goal is to increase sales, your KPI might be “number of orders processed daily”.
- Target Metrics: Measuring progress is only fruitful if you have a target in mind to define your progress. For example, a target metric could be achieving “x sales or signups per month”.
Think of this as a four-step process to go from broad goals to specific objectives. You start off by defining what’s important to you as a business, then you shift to your website goals, your KPIs, and eventually, the target metrics that would dictate whether a test is a success or a failure.
Here’s a graphic to help you map out this process:

Understand that your objectives and goals will not necessarily be singular. You might want to grow your revenues and increase sign-ups to your newsletter simultaneously. Each test, however, should focus on only one target metric.
Once you’ve defined your business goals, dig through your data to find any correlation between the two.
A few data points that usually indicate a problem in most businesses are:
- High bounce rate on money pages (such as product or payment pages)
- High shopping cart abandonment rate
- Low average time on site
- Low NPS (Net Promoter Score)
- Frequently cited issue (such as a site bug) in interviews and customer surveys
- Poor eye-tracking/mouse tracking results (customers not looking at areas you want them to focus on)
- Poor results from usability tests
After you’ve gathered this data, ask yourself:
- Does this problem affect my long-term business objectives?
- Does this affect my website goals?
- Is this a KPI for my business? If yes, what should be the target metric for it?
- Is there a monetary cost associated with this metric (short or long-term)?
If the answer to any one of these questions is ‘yes’, it represents an issue you need to test and solve.
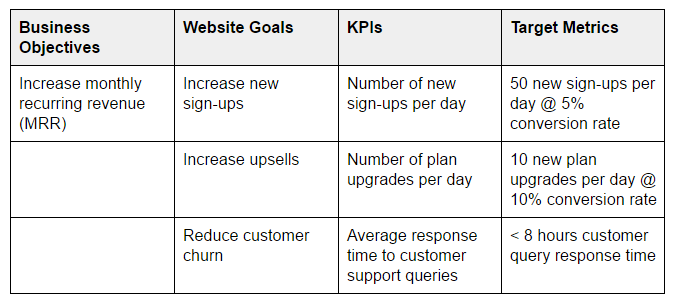
Example: SaaS Business
To help you understand how this process works, let’s consider a hypothetical case.
Suppose you’re running a SaaS business that sells marketing software. Your objectives and target metrics could be as follows:
CRO vs. UI/UX Problems
It isn’t uncommon for businesses to confuse CRO issues with UI/UX issues.
It’s easy to understand why: good UI/UX generally leads to better conversions and customer loyalty. This overlap can make you believe that every problem on your site is also a CRO problem.
In truth, a problem is only a CRO problem if it affects your business and website goals. Otherwise, it is just a design problem.
Let’s consider an example. Suppose you get a lot of emails from customers complaining about a missing “Contact Us” button. This would crop up in your qualitative data-gathering phase.
However, unless and until this affects your business objectives and website goals, it would remain a usability issue, not a CRO issue. Sure, it would be a good idea to make the “Contact Us” button more prominent, but it shouldn’t cannibalize your focus on meeting your business objectives.
Conversely, if your qualitative data shows that customers abandon their shopping carts because they can’t trust your site, it would most definitely be a CRO issue (since high shopping cart abandonment equals lower sales – a business objective), not just a UI/UX issue.
Keep this in mind when you’re trying to identify problems on your site. Remember that:
- If it affects your business and website goals, it is a CRO issue.
- If it affects only your site’s usability, it is a UI/UX issue.
Obviously, in your testing, you should prioritize CRO issues over UI/UX issues.
After you’ve identified your problems, it is time to develop hypotheses for solving said these problems.
Stage #2: Develop a Hypothesis
The next step in the A/B testing framework is to develop a hypothesis for solving the problems you identified in stage #1 above.
For example, suppose your data reveals that your customers abandon their shopping carts at the checkout page.
This is an obvious CRO issue, so to solve this problem, you develop a hypothesis:
Hypothesis: Improving trustworthiness, reducing friction and addressing customer FUDs (Fears, Uncertainties, and Doubts) will help us reduce the shopping cart abandonment rate.
Going by accepted wisdom, existing case studies and psychological studies, you develop multiple solutions, such as:
- Adding multiple payment processors to ensure that customers can use the payment method of their choice.
- Adding trust seals and security badges to signal better security and safety.
- Adding trust markers such as testimonials, social proof, etc. throughout the page.
- Offering 30-day money-back guarantees to improve customer confidence.
All of these represent different solutions based on the hypothesis to solve a stated problem: reducing the shopping cart abandonment rate.
This is essentially the second stage in the A/B testing framework: learning on past lessons, case studies, established best practices and theory to find hypothetical solutions to different conversion problems.
The obvious question now is: how do you develop your hypothesis?
Let’s find some answers.
How to Develop Your Hypothesis
Developing a hypothesis can be tricky; you have to often rely on subjective data and intuition to get things right.
Below, we’ll look at some tactics to help you develop your hypothesis.
1. Case Studies
Conversion rate optimization relies heavily on case studies to guide best practices and develop a new hypothesis. While it’s not always true, case studies often represent solutions that might work in a given situation.
Since at the hypothesis stage, your job is to collect as many plausible solutions as you can, digging through case studies can be extremely useful.
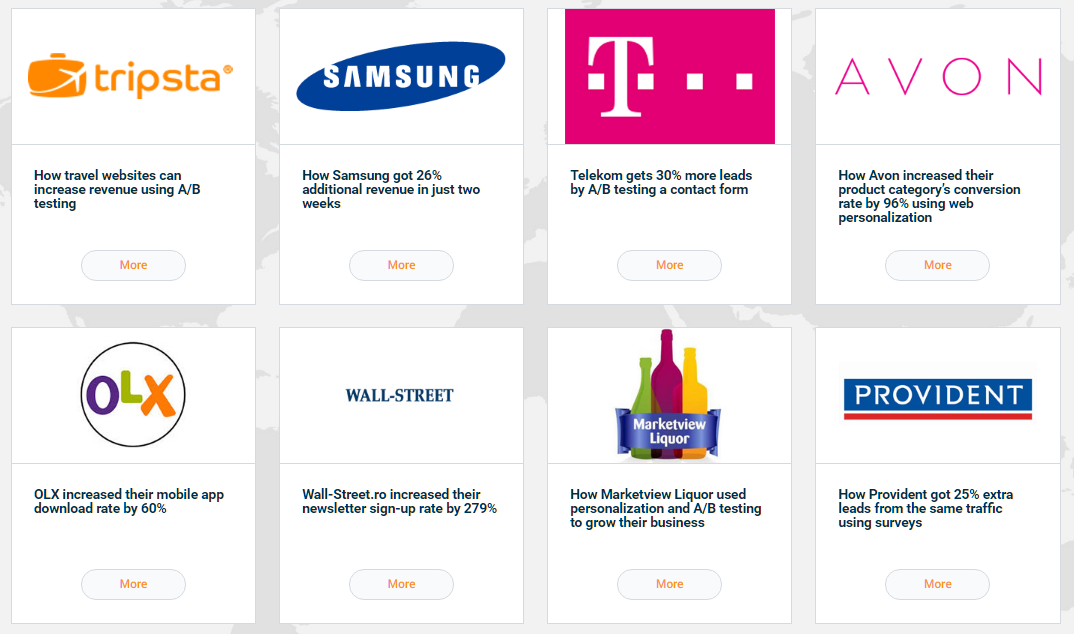
We’ve already covered a number of case studies earlier and their impact on your results. If you Google “CRO case studies”, you’ll find plenty of more results to guide your tests.
For example, here are our case studies:
However, not every case study will actually yield actionable insights to your specific case. When evaluating a case study, consider these issues:
- Relevancy: Is the case study describing a problem that is relevant to your particular problem? A larger button may have increased sign-ups for a free SaaS app, but it might not yield the same results at the checkout page of an E-commerce store.
- Audience overlap: Is the case study about a website that has a similar audience to yours? Results from a sports E-commerce store might not necessarily apply to a media company.
- Accuracy: Are the results from the case study accurate enough? Was the testing carried out to a high degree of confidence? Far too many times, you’ll find companies promoting case studies that are not statistically accurate.
- Recency: Are the findings from the case study recent enough? Have new trends impacted these results? What worked for a brand in 2006 might not hold true in 2016
- Scope: Plenty of case studies focus on “small wins” or micro-conversions, such as the CTR for a button. Such results might look good, but unless they improve your target metrics, they are effectively meaningless. Always consider the scope of the study before borrowing its learnings in your own tests.
2. Best Practices
Best practices are just that – a practice assumed to be correct by default in any non-specific case.
For example, placing your navigation bar at the top of the page is a “best practice”.
Of course, in case you want to build a unique experience, you might place the navigation bar in the sidebar or even the footer. These, however, are unique cases; for 99% of sites, the navigation bar at the top of the page would be the default choice.
Best practices spring from three things:
- Convention: Some design choices are made just because that’s the way things have always been done. In most cases, it’s better to follow conventions since your customers are already used to it. Breaking convention might cause confusion.
- Theory: Some design choices spring from theory. For example, psychological theories state that we are likely to equate strong social proof with trustworthiness. Hence, including reviews, testimonials, etc. has now become a “best practice”.
- Testing: When usability and CRO tests yield the same insights consistently, they often become best practices. For instance, testing shows that descriptive CTAs (such as “Download eBook”) regularly perform better than plain CTAs (such as “Submit”). This can now be said to be a “best practice”.
As we’ve mentioned in the past, best practices are just that – best practices. They hold true in most cases but not in every case. A page that complies with best practices is a good start, but it shouldn’t be the final iteration of that page.
3. Theory
Conversion rate optimization sits at the intersection of sales, design, and psychology. As such, any hypothesis you come up with will likely involve theories from each of these fields.
To give you an example, good UI/UX design relies heavily on Gestalt psychology (such as the Law of Proximity and the Law of Similarity). This also informs the decisions you make when designing a conversion-optimized page.
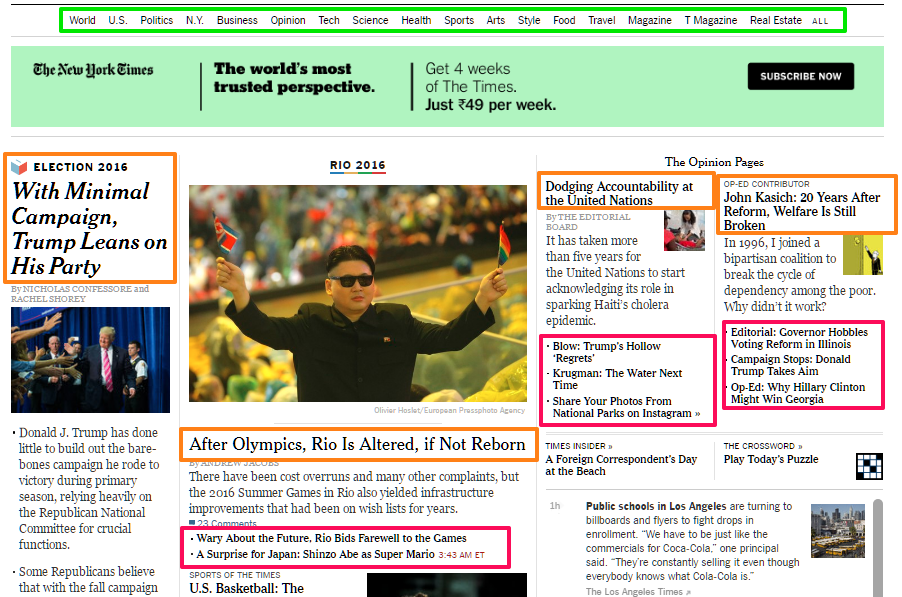
For instance, the NYTimes homepage uses Gestalt principles to group headings and sub-headings together. Main headlines have a larger font size while sub-headings for each section use smaller fonts. Navigation links, on the other hand, all have a smaller, uniform font size.
Similarly, CRO also relies heavily on sales and marketing (especially copywriting) theories that have been tested and refined over decades. Some of these spring from psychology as well, such as the principle of scarcity or the principle of authority when applied to design (more on this here).
A strong understanding of theory will help you create better hypotheses. You don’t have to know all of the above, but a firm grasp of psychological and emotional triggers that lead to sales will greatly help you improve conversions.
4. Experience
All the case studies and theories in the world can’t make up for the past experiences.
This is why CRO is often best left to experts; they can bring insights to the table that non-practitioners wouldn’t know.
It’s not unusual to find that the most successful hypothesis is usually the one that springs from experience, not theory or case studies. A CRO expert who has already dealt with a site similar to yours in the same niche will likely have tons of ideas for improving your conversion rates.
Keep this in mind when framing your testing hypothesis.
Bringing it All Together
The hypothesis you come up with to solve problems you identified in stage #1 will likely borrow ideas from all of the above – case studies, best practices, theory, and prior experience.
Let’s look at a hypothetical case to give you an example.
Problem: Poor click-through rate from product page to checkout page.
This is what the control looks like:

This problem could be due to any number of issues, such as:
- Lack of customer trust
- Customers unsure of product quality
- Customers can’t find the checkout button
- Customers are turned off by high shipping costs/don’t know about shipping costs
Based on this, you develop a hypothesis:
Hypothesis: Reducing trust deficit, assuring customers of product quality, and making it easy to use the web page will help improve conversion rates for the product page.
With this hypothesis, you can brainstorm different variants
Case study: A case study states that larger “Checkout” buttons in a bright red color lead to better conversions for another website in a similar niche.
Based on this, you develop a variant like this:

Best practices: “Best practices” dictate that your product page should have plenty of reviews, testimonials, etc. to add social proof. Based on this, you create another variant like this:

Theory: As per design/marketing/psychology principles, conversions go up when customers trust your site more.
To boost your trustworthiness, you decide to make another variant with a bunch of “Featured in:” logos.

Experience: Your past experience optimizing similar sites that offer free shipping above a certain order value boost conversion rates by 10-20%.
Based on this, you make a variant like this:

Hence, from the standard page, you now have 4 variants based on case studies, theory, best practices, and experience.

This is just an example of how you can develop different solutions in the service of your hypothesis.
Make sure you keep the following points in mind while hypothesizing solutions
- Are the test variables you suggest measurable?
- Do your solutions actually have the potential to solve the conversion issue at hand?
With this insight in mind, you can finally begin to run split tests to find the optimal variant for your conversion metric.
Before you begin testing, keep in mind that your first A/B test is unlikely to lead to your target outcome and you will need to repeatedly test and refine.
Also, you are not limited to only one idea as a potential solution. You can have as many as you like.
Stage #3: Developing and Testing Page Variants
The third stage in the A/B testing framework is to actually create your page variants and start testing them one by one.
Before you can turn to your designer or landing page builder, you have to first prioritize your testing. It’s not unusual for businesses to waste thousands of dollars testing ideas with little to no impact on their bottom line.
Here’s how you can choose what to test, what to ignore:
What to Test First?
Prioritize items on your list using a scoring system.
- Low scores to elements which you believe will provide a minor boost
- High scores to those which you believe is the root cause preventing conversions.
While prioritizing, keep the following in mind:
- Ease of implementation: How much complexity, risk, and time is involved in testing one element compared to another.?
- Opportunity score: What is the maximum potential for one element to skyrocket your conversion as opposed to providing only minimal increments?
- Stage #1 goals. Does the variant improve conversion rates for one of the target metrics identified in stage #1? If not, give it a lower score.
A hypothetical testing priority chart might look something like this:
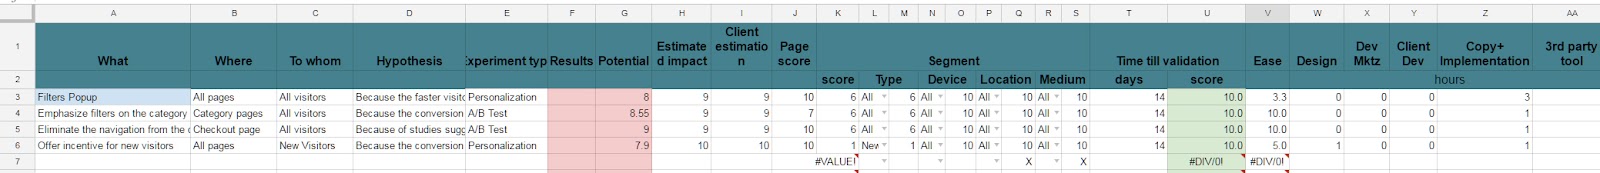
You can grab a copy of this template from this link.
We’ll look at test priority in the next chapter.
After you have selected a test you believe is a high priority and will deliver your desired result, you need to design the test.
Here is how to design an effective test:
Designing the Test
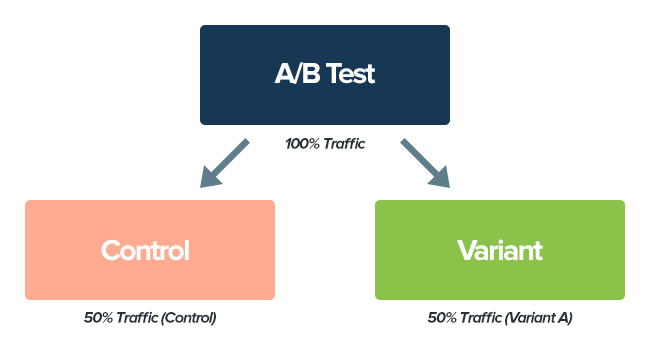
Remember that every split test diverts traffic equally between two variants of a page.
The default version of your page will be referred to as the “control,” and what you want to test will be the ‘variation or challenge,’ You can have multiple variations as in the example above (button size, location, and placement)
Here is a graphic which represents the format of the test
And, here is a graphic which shows how variations of your site may look against your control
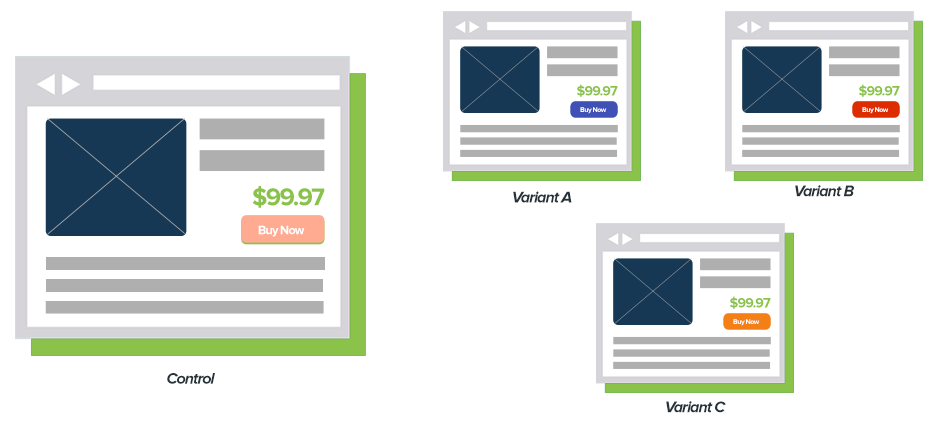
Variation A, B, and C are all different versions of the original control.
You will have four live versions of your site. 1/4th of your website’s traffic will be diverted to the control, 1/4th to variant A, 1/4th to variant B, and 1/4th to variant C.
For example, in the example mentioned above, you create various pages to test sequentially:
- Control will be the control where your contact button remains unchanged from its current style and design
- Variant B changes the button color to blue.
- Variant C changes the button color to red.
- Variant D changes the button color to orange.
Each of these three pages (A-C) will be tested against the control.
You also need to define your target goal in each test. This is what defines the accuracy of any test. If you want to increase the number of clicks on a button, you should be tracking CTR, not time on site.
Most tracking tools will also track the number of other metrics by default (such as engagement). You can think of these as secondary goals; your primary goal is still your target metric.
Developing Page Variants
Until a few years ago, if you had to make multiple variants of a page, your only option was to hire a designer and a developer. Since a typical test might involve dozens of variants, you can see why CRO was so prohibitively expensive for most businesses.
Thankfully, modern CRO software usually includes robust tools to change pages on the fly for higher conversions.
For instance, Omniconvert has a visual editor that can quick changes to any page.
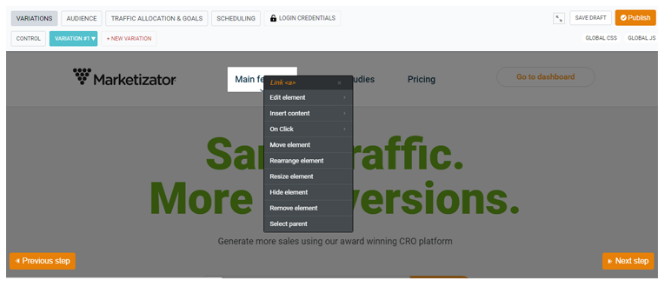
This can help you make changes to any page without fiddling around with code. All you need to do is make your edits, save the variant and start testing.
In the next chapter, we’ll explore some more options for making your page variants.
Once you’ve designed your variants, you can start sending traffic to the control vs. the variants.
Ensure Test Quality
Before you can launch your test, you must ensure that your page variants render as faithfully as possible across all devices and browsers.
This is easier said than done. Just to give you an example, this is what the global browser share looks like as of July 2016:

If you have a lot of users that still use outdated browsers, you might have to make multiple page variants to ensure that your changes are visible to all your users.
To figure this out, first log into your Google Analytics and go to Behavior -> Technology -> Browser & OS:
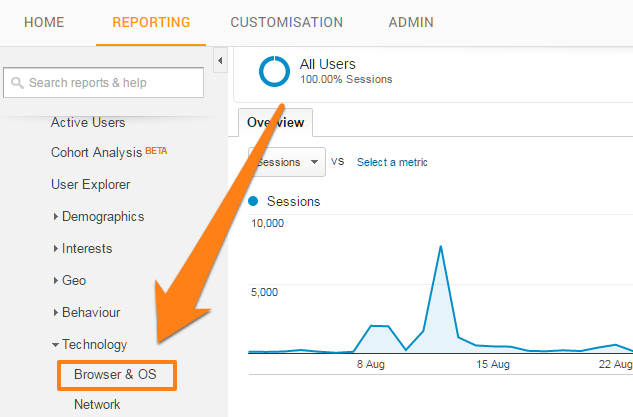
This will show you the browsers used by your users:
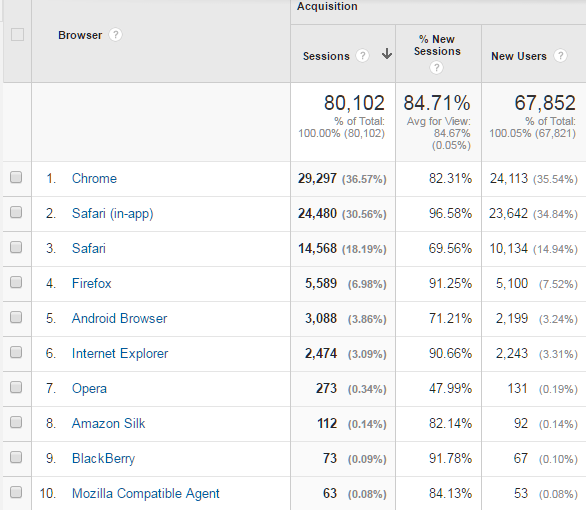
Ensure that your page renders faithfully on most of your major browsers. You can use Browserstack.com for this.
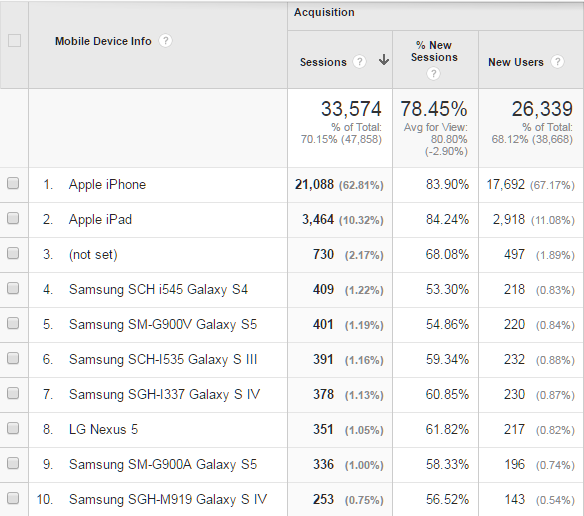
Do the same for mobile devices by going to Behavior -> Technology -> Mobile -> Devices. Your page should render sufficiently well for most of your traffic.
If you use a tool like Omniconvert’s visual editor to make your page variants, you shouldn’t have any problems with page render issues.
After checking for page render issues, also make sure that your tracking codes are setup. Once done, you can go ahead and launch your test.
Stage #4: Analyze Test Results and Implement Changes
The testing process usually ends when a variant leads to statistically significant changes in your target metric. While theoretically, you can keep on testing forever to boost conversion rates as high as possible, in most real-world scenarios, the testing stops when you reach a target figure (say, x% CTR for a button).
In the real world, after all, resources are limited and businesses have to prioritize their spending.
The question now emerges: how do you analyze test results? How do you ensure that your results are actually accurate?
You’ll find answers to these questions in the fourth and final stage of the testing framework.
Post-Test Analysis
Regardless of what you’re testing, your test will always have one of three results:
- Control wins, i.e. the original version outperforms every other variant.
- Variant wins, i.e. one of your tested variants wins against others and the control.
- No result, i.e. there is either no statistical difference between the control or the variant or you don’t have enough traffic to draw a statistically confident conclusion
Similarly, your test will also have multiple goals:
- A primary goal, i.e. the metric you are optimizing for, such as new account sign-ups.
- A secondary goal, i.e. additional metrics the testing software tracks, such as newsletter sign-ups.
- Interaction metrics, i.e. metrics not essential for conversion rate but good to have nonetheless, such as time on page, bounce rate, etc.
The accuracy of your test results is expressed in the form of statistical confidence. For best results, you want your confidence level to be at least 95%.
Also, understand that testing speed and accuracy is a trade-off. Running simultaneous results may be quicker but the data will be polluted and you may end up confused as to which variation led to your objective.
It is more effective to run tests one at a time and ensure that you test all variants for the same period of time to ensure accuracy.
If you don’t have a lot of traffic, you might end up running the test for several weeks and even months to hit 95% statistical confidence.
Segment Post-Experimentation
Digging into your test results can often reveal deep insights into your audience.
For instance, your test results might show that variant A performs 10% better than the control when it comes to the overall conversion rate.
However, once you dig through audience segments, you might find that for iPhone users, the control performs 20% better than variant A.
This deep segmentation can help you make better decisions. In the above case, you might choose to show the control to iPhone users and variant A to all other users.
Collate Learnings from Each Test
It’s a good idea to make a list of learnings from each test you run. This can be your own custom database of testing ideas. Plus, it can reveal deep insights into your customers.
For example, suppose you test two variations of CTA button copy, like this:
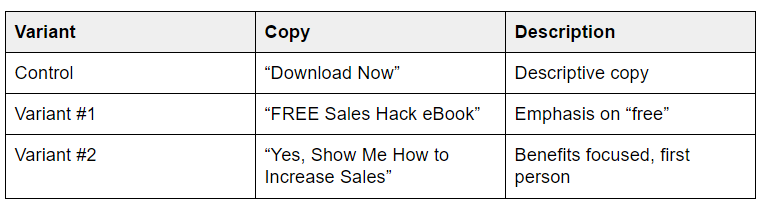
If your test shows that variant #1 wins over other variants, you can say that your audience responds more to free stuff – at least on the page in question.
You can draw dozens of similar conclusions from your tests. Combined, these can help you understand your audience much better. You can also use these learnings to create better tests in the future (say, focusing on “free” in your landing page copy as per the example CTA test above).
Test Further
After you run the tests and gain insight into which version increases click-through-rate the most, you can branch-off and create even more A/B tests.
For example, if testing reveals that variant #1 – which increases the size of the button – increases your click-through-rate the most, you can test for (based on the new size):
- Button color
- Button location
This way, you can optimize endlessly for higher conversions if you have the resources for it. This also makes the A/B testing framework more open-ended – findings from one test can inform the direction of other tests.

Take Action on New information
Finally, once you have a winning variant, you can go ahead and incorporate the page in your design.
This concludes the A/B testing framework and how to create an A/B test. In the next section of the chapter, we’ll run you through how to create an A/B testing strategy.