


When a new e-commerce client approaches us for a service like LTV or retention optimization, we typically start by asking them if they’re doing RFM segmentation, or what type of customer segmentation they use.
In most cases, medium and large web shops have some segments defined in their CRM, and they use the groups for paid ads and targeted e-mail campaigns.
However, a lot of our clients do not know how to segment their customer base in a way that allows them to extract actionable insights from all the collected data.
For this reason, our CLV optimization framework includes also the RFM customer segmentation, which is done in REVEAL, to save us time and to make sure we have all the insights available immediately.
If you’re new to our tool, we’ll give you an overview of how the segmentation works and how you can use the RFM groups to make better marketing and assortment decisions.
Overview of REVEAL, our RFM Segmentation Tool
REVEAL is a Retail Analytics tool that offers automated advanced reporting for eCommerce. The software is analyzing customer, product, and order data, based on two main metrics: Cost of acquisition (CAC) and RFM scores.
The dashboard provides insights into:
- NPS scores,
- Retention Rate,
- Product Return Rate,
- Gross Margin per Customer Type,
- Cohorts, and
- Customer Lifetime Value.
The purpose of the RFM analysis is to help you understand which customers, products or services are dragging your business down and which ones are or can fuel the growth.


If you’re using a different e-commerce platform, feel free to book a demo here.
How the RFM Customer Segments Are Set Up
The RFM segmentation is used for identifying the most valuable client groups and enables companies to target specific clusters of customers, based on common behavior patterns.
The insights derived from an RFM analysis can be used to improve the targeting of paid ads and marketing campaigns, as well as to craft personalized loyalty programs.
Together, these can help in attracting more profitable customers, who stick around for longer and thus are more valuable in the long run.
RFM stands for:
- Recency – How recently did the customer purchase?
- Frequency – How often do they purchase?
- Monetary value – How much do they spend?
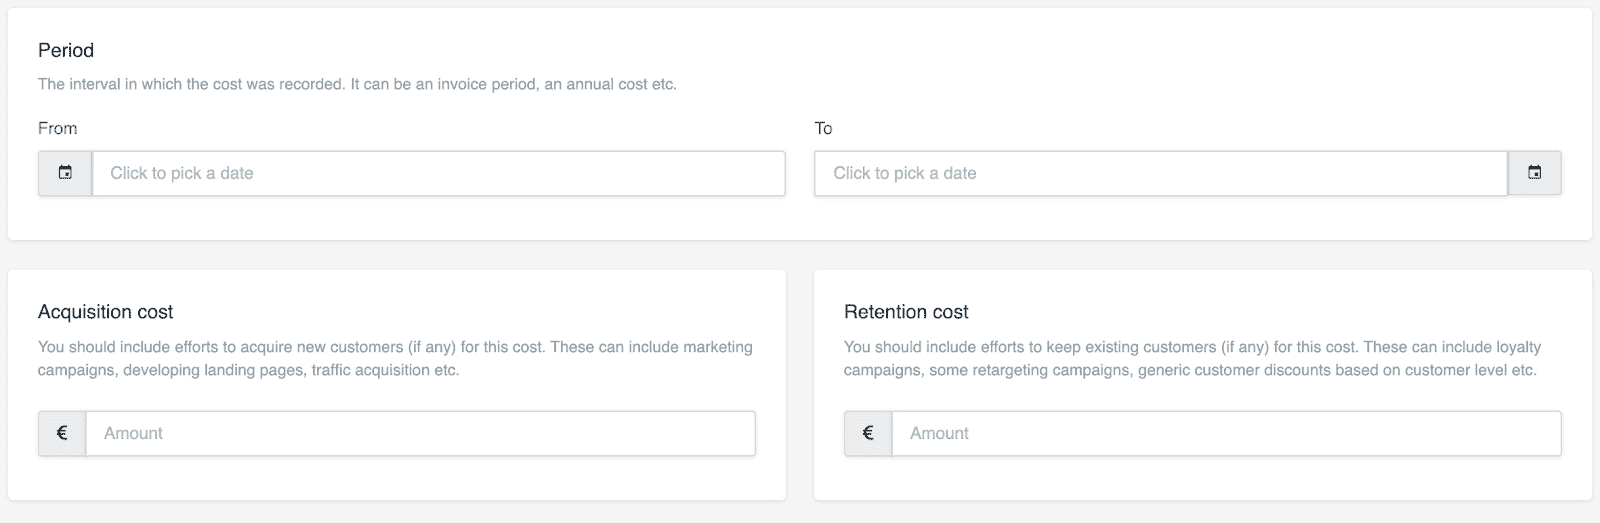
To get an accurate estimation of a client’s lifetime value, you need to consider not only the revenue and profit generated by that customer but also your acquisition costs.
In REVEAL, these are added under CAC, and represent the sum of all marketing & sales efforts that are needed to acquire a new customer, in a given time period.
Along with acquisition costs, our tool enables you to add your retention costs also, if you have expenses related to loyalty programs or discounts for example.
The RFM model and the scores assigned to each client segment
The system is automatically assigning points for recency, frequency, and monetary value to each customer. Once this initial attribution is done, the clients are grouped into clusters that share similar RFM values.
In the tool’s settings, you can change the values and create different intervals for the R, F, and M scales, according to your business model.
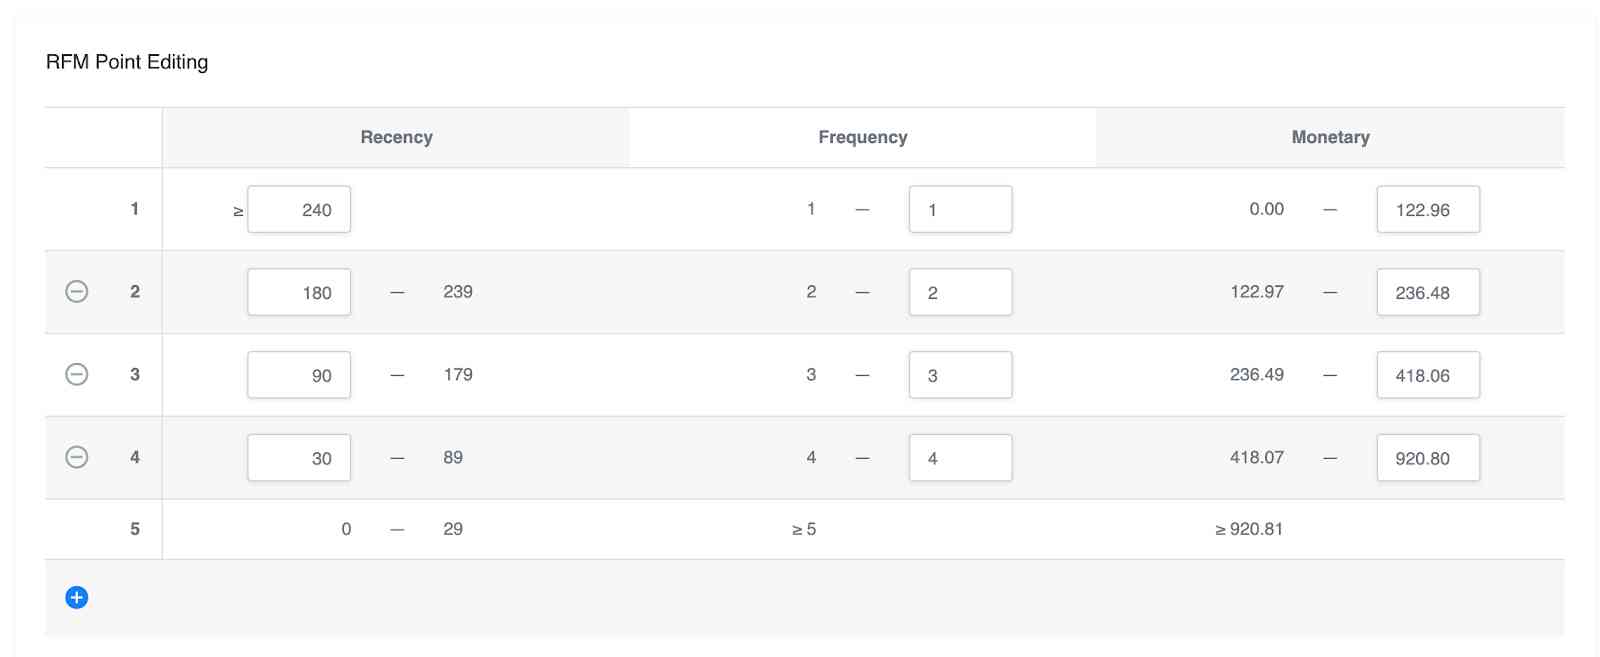
Once you connect REVEAL to your store, it imports your Customer, Product, Category, and Order data. Based on the values in your RFM model, the software segments your customers into multiple groups.
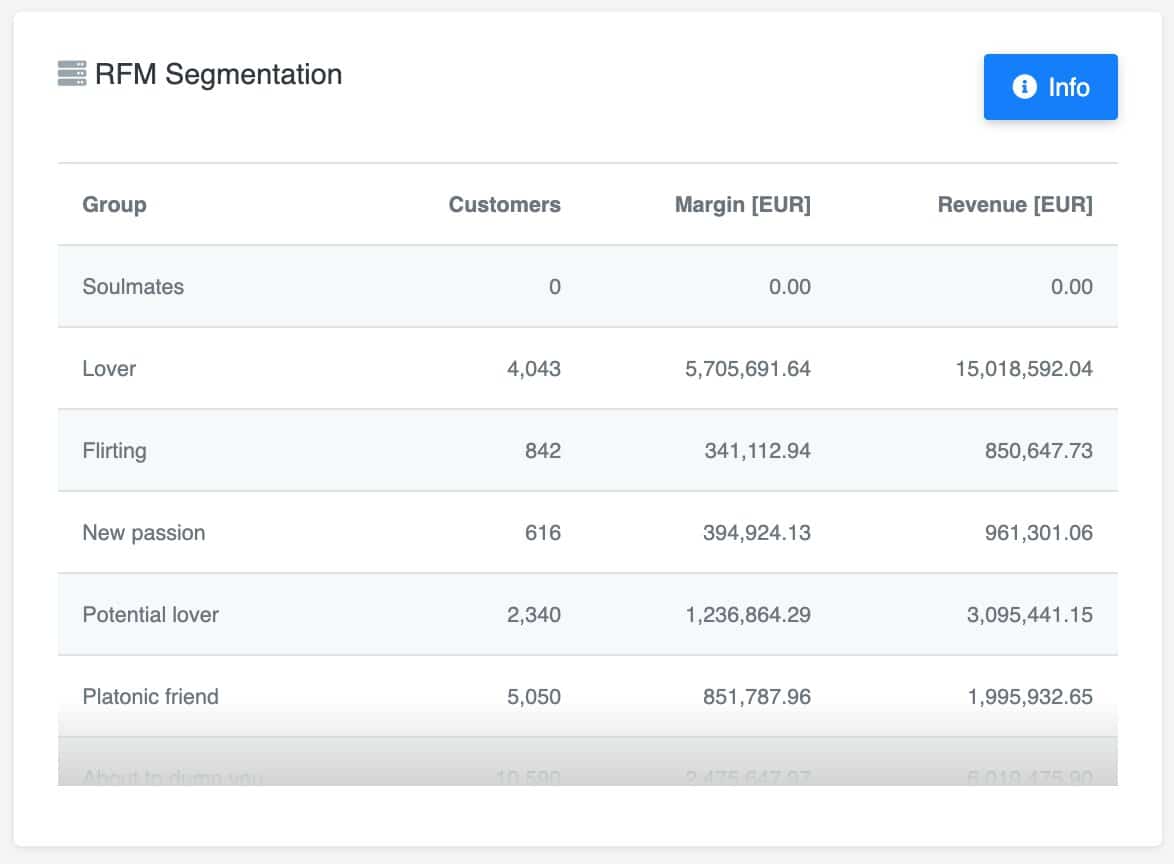
The 11 Types of Customer Segments You’ll Find in REVEAL
- Soulmates: these are your most valuable customers. They bought the most often and have spent the most in your online shop. Their latest order has been recently placed.
- Lovers: these are active customers who have placed a couple of orders, the last one being placed recently.
- New Passion: these customers placed 1-2 orders of the average value
- Flirting: these customers are active on and off. They’ve placed a couple of orders of high-value orders, but are inconsistent.
- Potential Lovers: they’re active customers who placed a couple of high-value orders. They have the potential to become Lovers.
- Platonic Friend: these customers are active but place very few orders of small or medium value.
- About to Dump You: these are inactive customers, having placed their latest order more than 6 months ago.
- Don Juan: these customers have placed only one order but high-value
- Ex-lovers: these are your former True Lovers or Soulmates, who have abandoned your website and are now inactive. You probably don’t know why they stopped buying.
- Apprentice: these are the new customers who just placed their first order
- Break-up: these customers are inactive, they hunt promotions, hitting your margin. They used to place low-value orders.
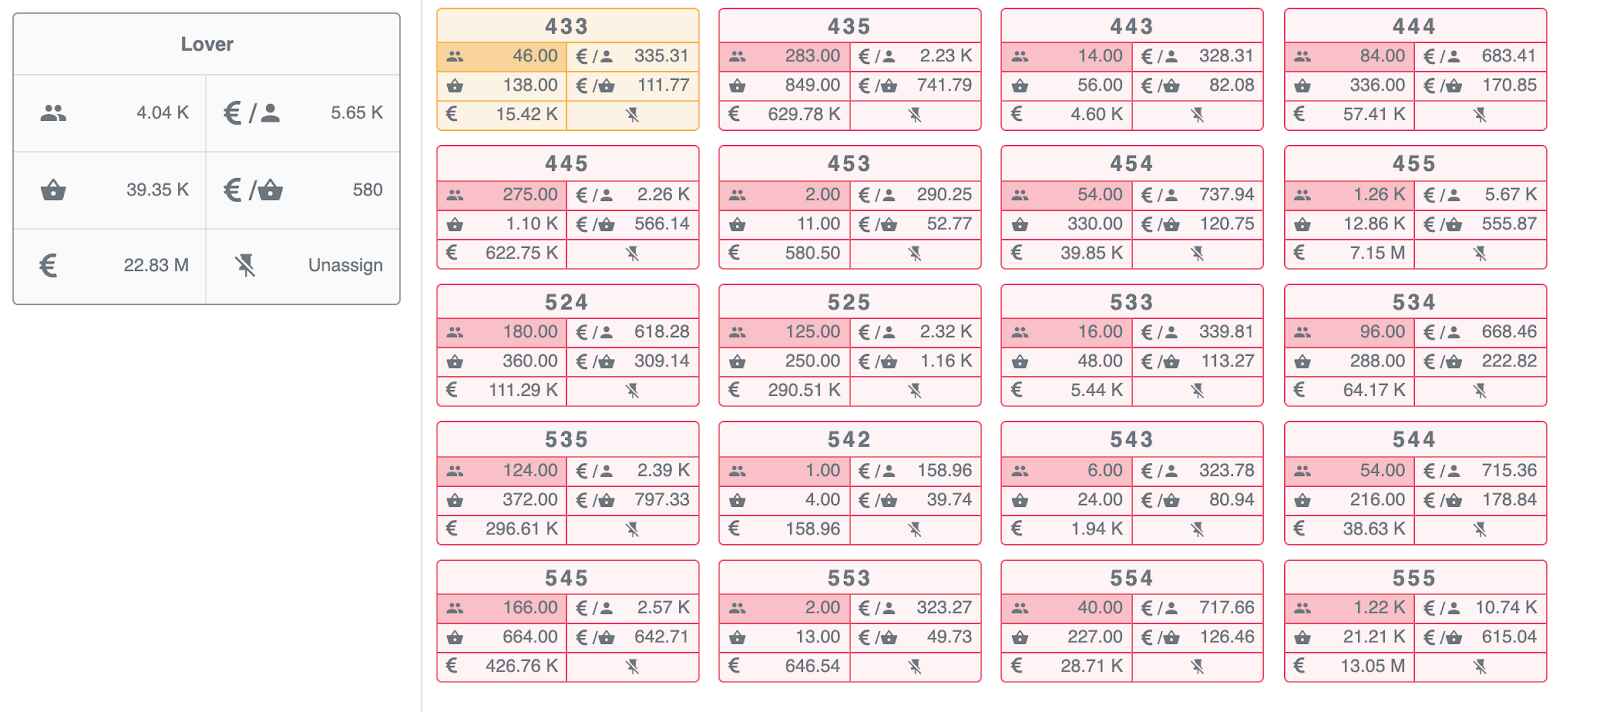
How to Customize RFM Segments
These client groups are not cast in stone, so if you see that there are only a few customers in a group, you can easily drag and drop them in another segment.
You can also change the name of the segment so something that makes more sense to you.
REVEAL’s Customer Segmentation Dashboard
The RFM dashboard gives you an overview of the key metrics for your e-commerce growth, each area having a separate tab. We’ll look at the most important reports and the insights that you can extract from them.
Revenue vs. Margin report
Probably the most revealing report is the revenue vs. margin one, which shows the total revenue and margin per RFM segment and per new vs. returning customer.
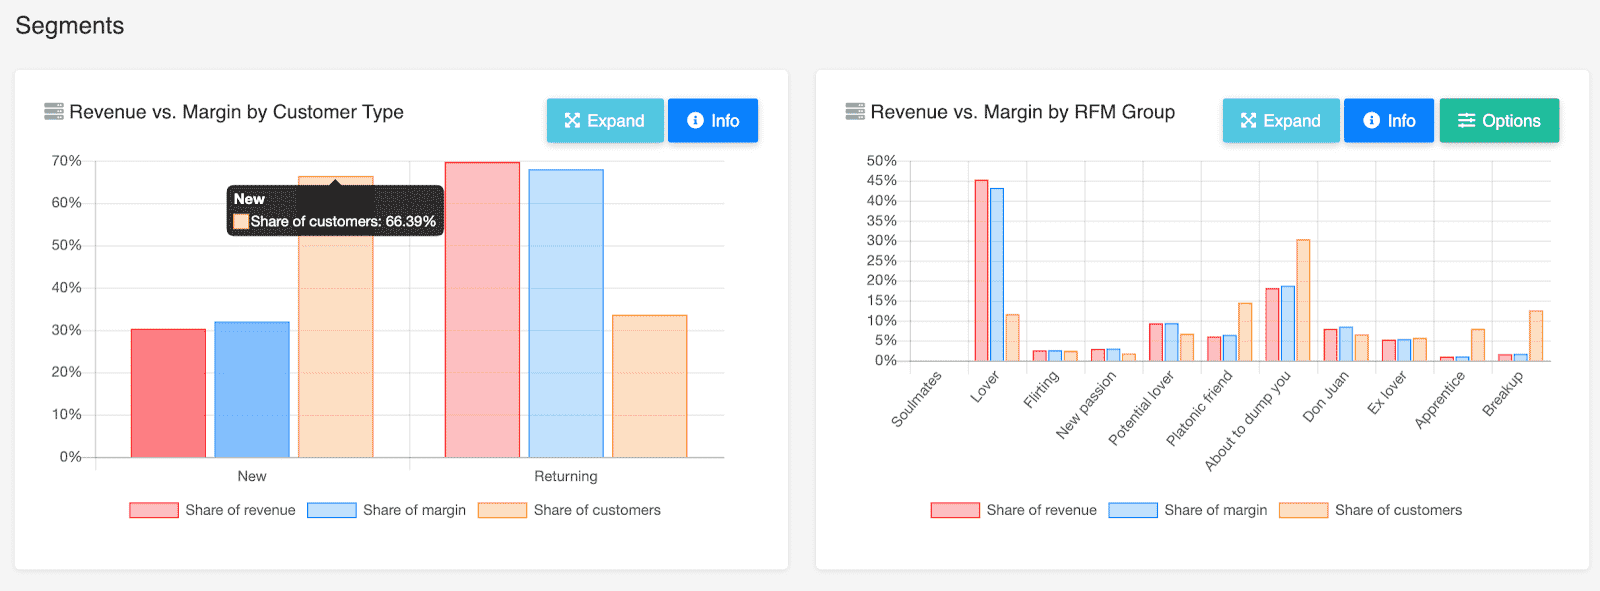
In most cases, the Pareto principle applies, meaning that 20% of the customers bring in 80% of the revenue, and the most profitable customers have a better gross margin than the rest.
But who are these customers? The REVEAL dashboard offers a series of reports that allow you to drill down into their behavior, so as to find patterns and similarities.
Top Customers Report
This report shows you who your most and least valuable customers are, and to which RFM group they belong.
To make the most out of this feature, you should analyze their profile to see if the demographic data is similar, or if the products they buy and the preferred shipping methods are the same for your most profitable customers.

Product Return Rate Per RFM Group
Product returns not only tell you which are your worst performing products but can also reveal different behavior across RFM groups.
For example, you might notice that your Lovers and Soulmates are buying the same categories or brands, while the Breakups have stopped ordering after buying similar products.
Such insights are valuable for cross- and up-selling campaigns, as well as for personalizing your paid ads per target segment.

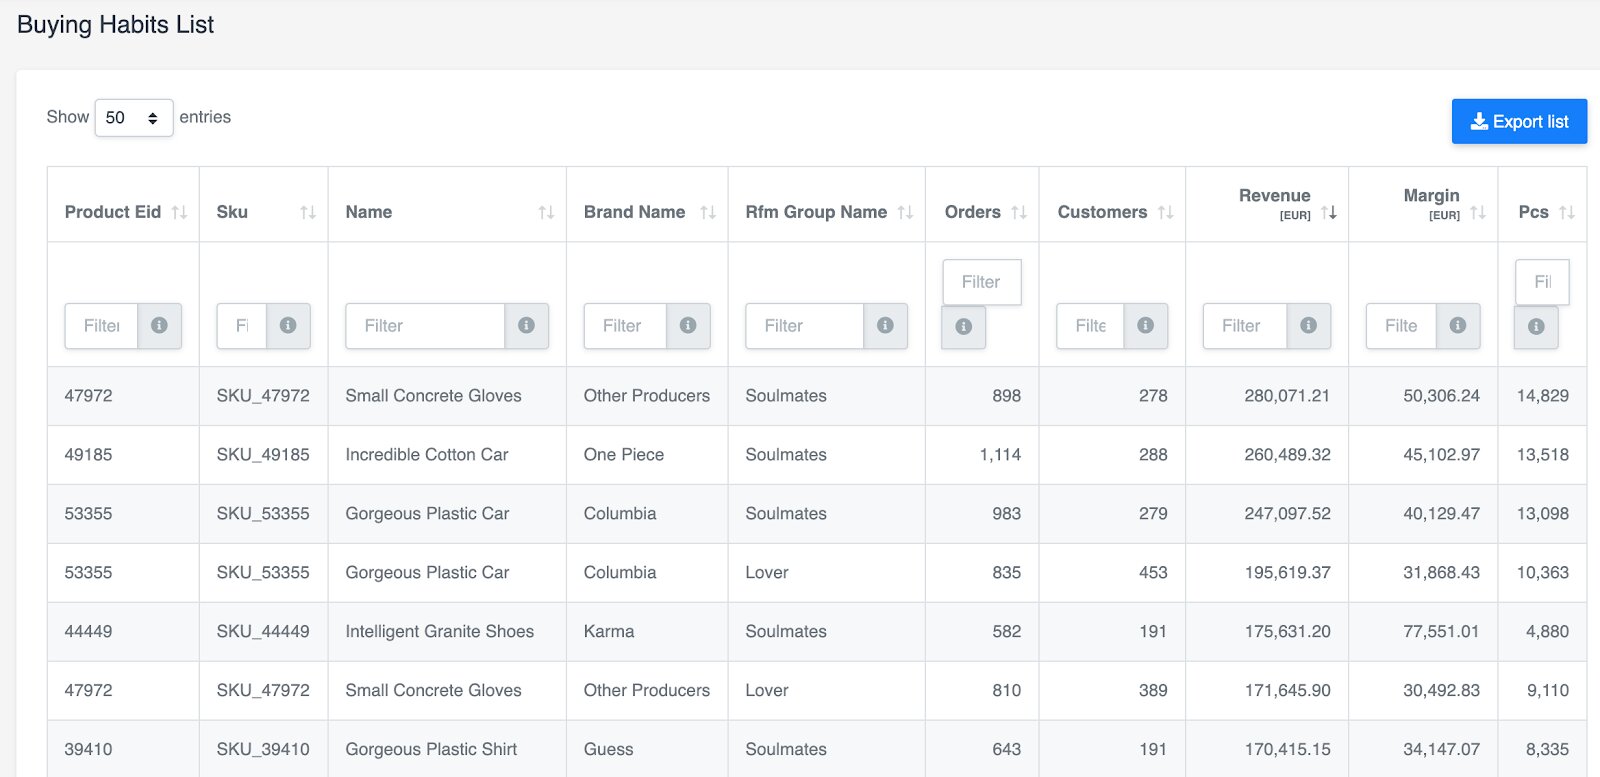
Buying Habits Report
Just like the Product return report, the Buying habits dashboard reveals information about your client’s preferences and the performance of your products and brands.
Among others, this report gives you insights into the products that are bought more often by your top-performing segments.
If you own a Shopify store, you can start analyzing your customers’ behavior right away by installing the REVEAL app. It takes less than 5 minutes to set it up, and you’ll get instant access to all the dashboards listed here.
Add REVEAL to your Shopify store.
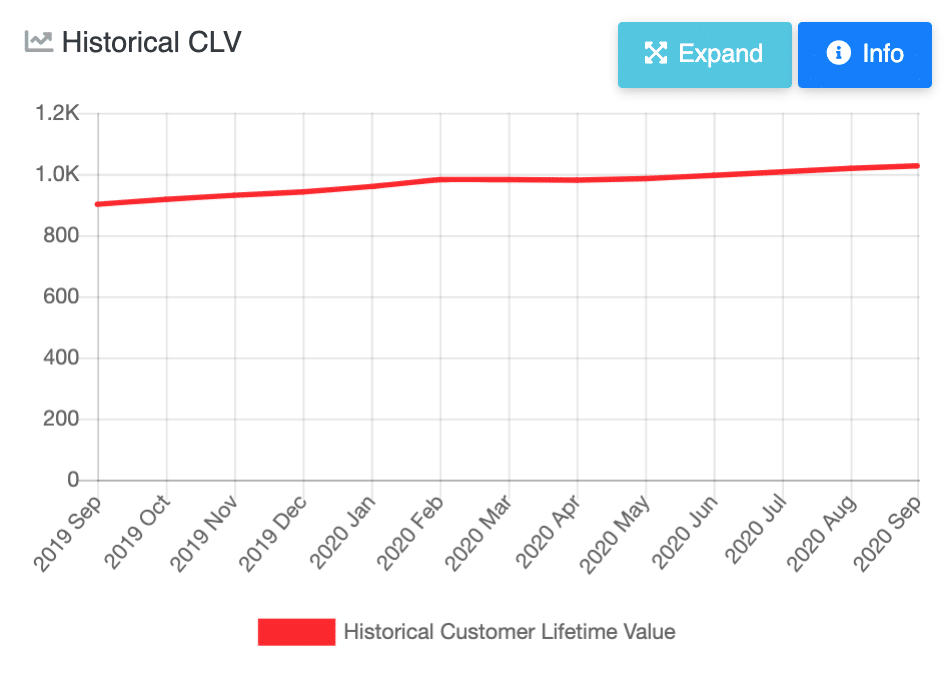
Customer Lifetime Value Report
While the buying patterns can also be analyzed with data from Google Analytics, the CLV report takes a lot of time and effort to compile with other tools.
Before building REVEAL, we were using Excel tables and importing the data into a BI tool, but our software does all these calculations automatically.
The customer lifetime value is calculated based on several different equations, so it takes into account multiple factors, such as:
- Average Customer Lifespan,
- Customer Retention Rate,
- Profit Margin per Customer,
- Rate of Discount,
- Average Customer Value per period.
These metrics are computed based on the data spanning 1 year behind (relative to the end of the selected period).
Your shop’s CLV can fluctuate over time due to changes in the factors mentioned above, but it’s an essential piece of information in the business puzzle.
Knowing your LTV per RFM segment means that you know what type of customers you want to attract and to which segments you should dedicate more time and attention.
A Soulmate is more valuable for your store than a Don Juan, so the customer service, the packaging, and the targeting across channels should reflect that.

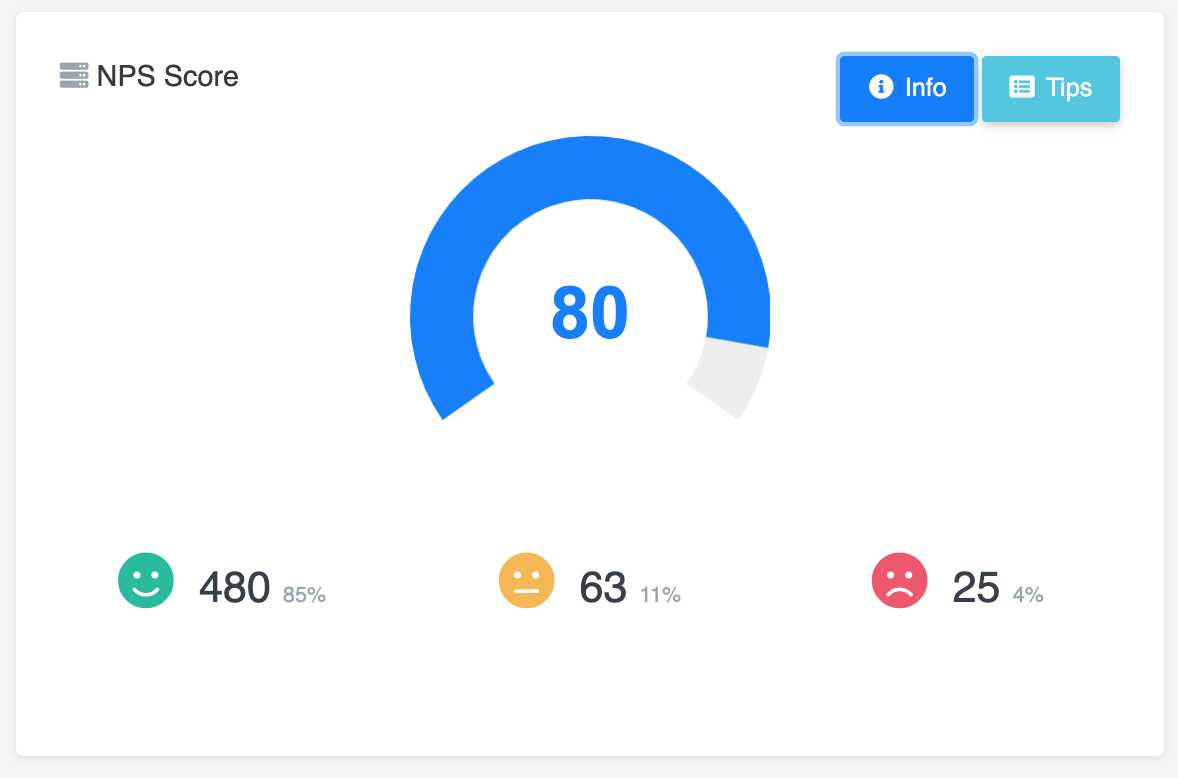
NPS Score Dashboard
The Net Promoter Score (NPS) measures your clients’ satisfaction with the products and services received and is a good reflection of the overall customer experience. Although not directly related to the CLV, this metric is a good predictor of business growth.
NPS shows you how likely your customers are to recommend your shop to a friend or colleague. REVEAL enables you to send surveys for measuring the NPS pre- and post-delivery, so the score is measured continuously. This makes it easier to know when and where to act.
The NPS score highlights many strong and weak points of your business and grants a voice to your customers in each group.
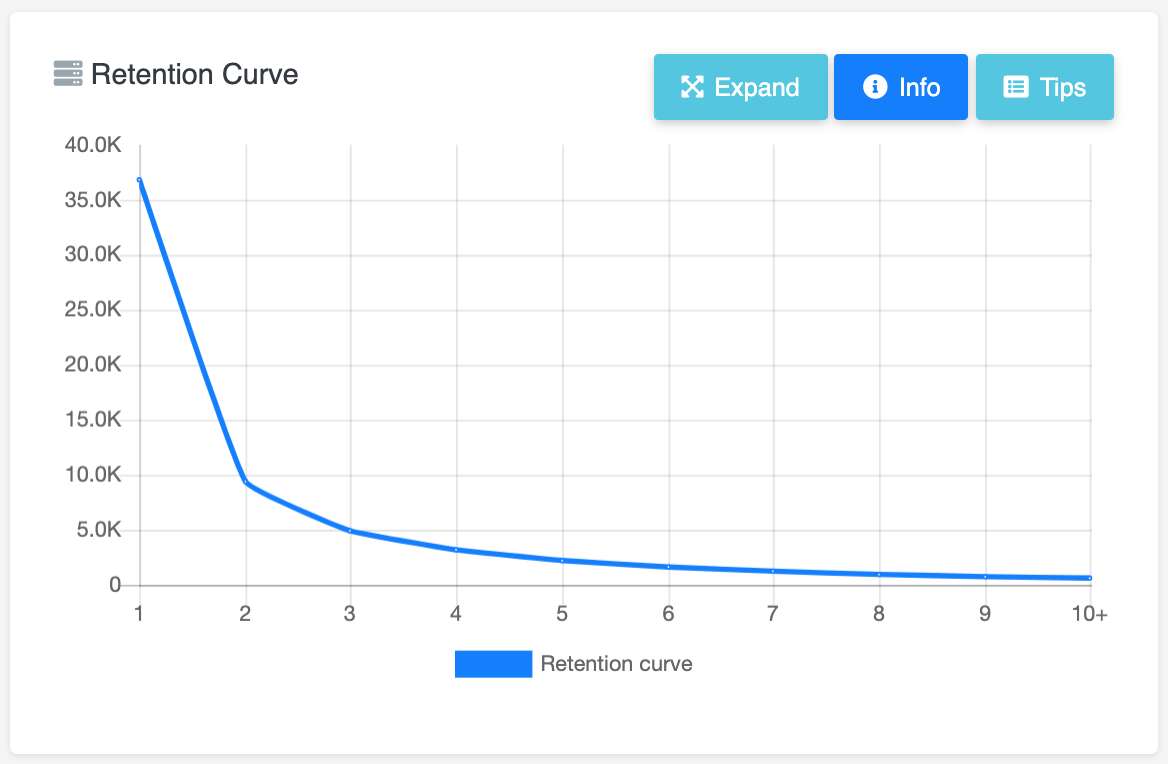
Retention Rate Report
The retention rate calculates the percentage of customers in your database that place more than 1 order in a given period of time.
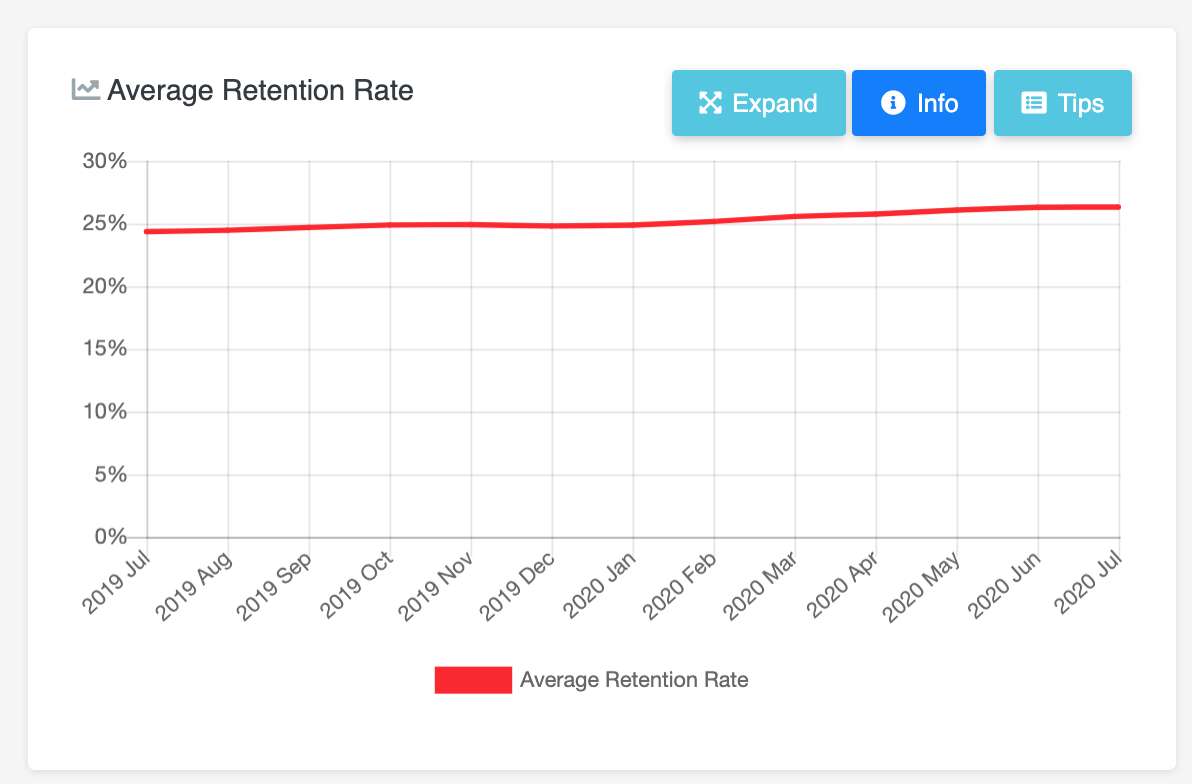
Your goal is to turn your new clients into recurring ones and retain the existing customers. If your retention rate is showing a negative trend, it can indicate that you’re not acquiring your ideal customers, or that your onboarding and retention strategies are not the most efficient.
Curious to see how your store is performing in terms of retention? If you own a Shopify webshop, you can install the REVEAL app and get access to this report right away.
Add REVEAL to your Shopify store.
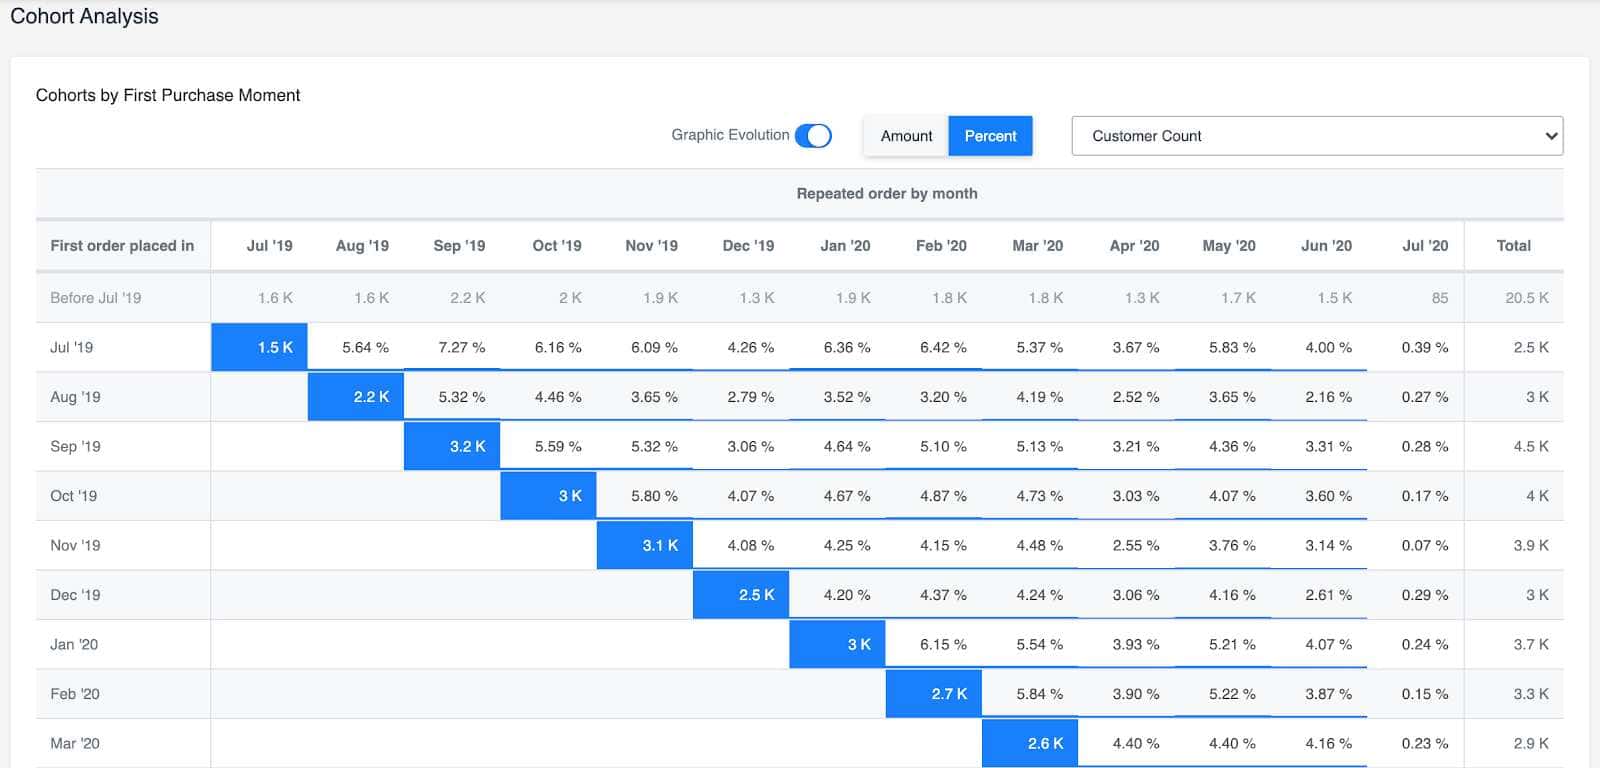
Cohort Analysis Report
The Cohort analysis report groups customers by common characteristics. In our example below, each cohort shows the number of customers acquired each month, as well as their stickiness over time.
If you are running different promotions and campaigns every month, the cohort analysis dashboard shows you how effective your marketing efforts are.
Also, it reveals the strategies that are more successful in retaining your most profitable customers.
How can you use all these insights to improve your retention rate and customer satisfaction? We’ve detailed our process and methodology in Otter’s success story.
They were one of the first customers to use REVEAL, and we managed to increase their retention rate by 6%, starting from insights like the ones described above.
Read the client story here.
How to add REVEAL to Your Shopify Store
The REVEAL app is available in the Shopify marketplace, and you can add it to your store by clicking the button below.
Add REVEAL to your Shopify store here.
The integration is very simple: you only have to click on the Install button, then connect your Reveal account or create a new one.
A minimum configuration of your store details will be needed, such as your average shop margin and how you want to manage the guest accounts.
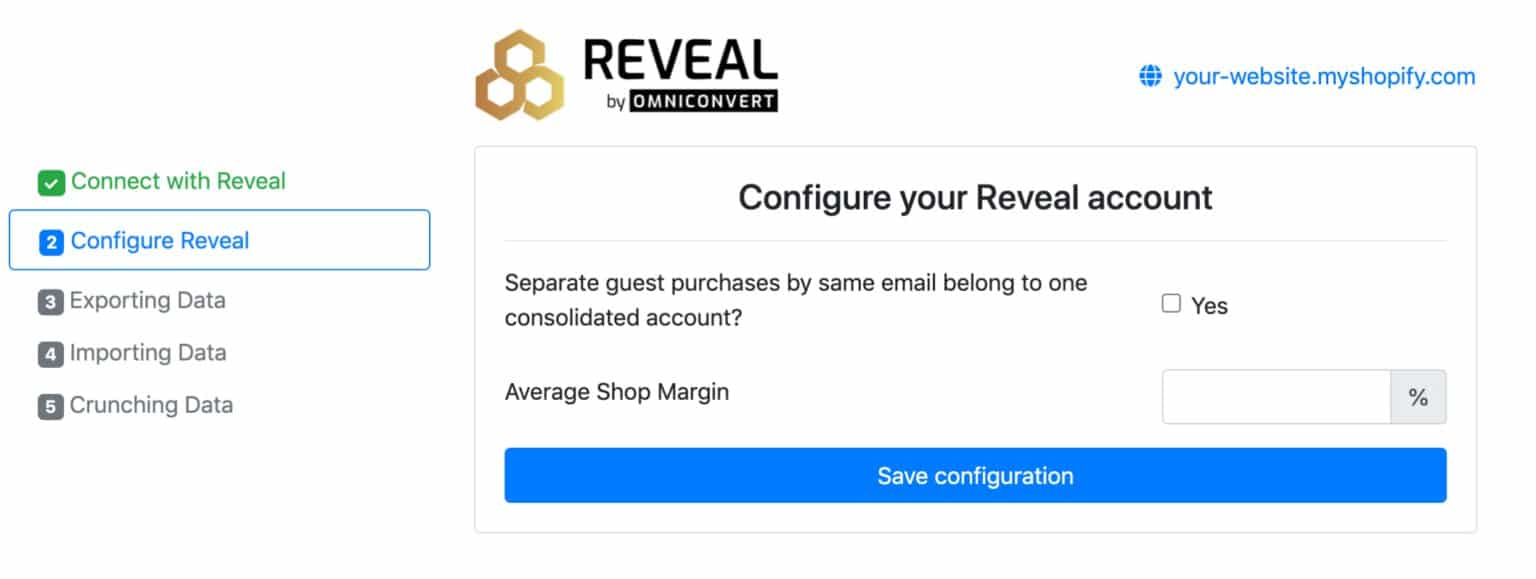
Reveal automatically extracts customer, category, product, and order data and within minutes you have the dashboard and your customer insights ready!
If you have a Shopify store, install Reveal here.
How to Integrate REVEAL in Your Magento Store
For Magento stores, the data imported by Reveal needs to be delivered within data feeds served via HTTP, using JSON format. For each type of data that Reveal requires, you’ll need a separate file: customers, categories, products, and orders.
The dashboard and reports available are the same for Shopify and Magento stores. Thus, once you import the data, you will get ongoing insights about your clients.
If you are on Magento, you can create an account to start using REVEAL here