


The categories of CRO metrics are tools for measuring and enhancing the performance of websites or applications in conversion rate optimization (CRO). The metrics help businesses understand user behavior, evaluate marketing strategies, and identify areas for improvement to achieve their goals. Organizations focus on specific aspects of user interaction and drive meaningful results by categorizing these metrics.
CRO metrics are measurable indicators that track the effectiveness of CRO strategies. They provide insights into user behavior, engagement, and outcomes, helping businesses optimize digital channels for higher conversions, revenue, and customer satisfaction.
CRO metrics are divided into ten distinct categories, each addressing a critical aspect of the user experience and business performance. They measure different stages of the customer journey, from acquisition to post-conversion.
The 10 Categories of CRO Metrics are Listed Below
- Engagement Metrics: Engagement Metrics measure how users interact with the website or app. Key examples include bounce rate, time on page, and pages per session. They help identify content effectiveness and user interest.
- Conversion Metrics: Conversion metrics focus on the rate at which users complete desired actions, such as form submissions, purchases, or sign-ups. Metrics like conversion rate and click-through rate are pivotal in assessing CRO efforts.
- Revenue Metrics: Revenue metrics track the monetary outcomes of user activity. These include average order value (AOV), customer lifetime value (CLV), and revenue per visitor, crucial for understanding the financial impact of CRO strategies.
- Acquisition Metrics: Acquisition Metrics evaluate how effectively attract users to the website. Metrics like cost per acquisition (CPA), traffic sources, and organic vs. paid traffic ratios highlight the success of the marketing efforts.
- Behavioral Metrics: Behavioral metrics analyze user actions on the site, such as heatmaps, session recordings, and scroll depth. They reveal how users navigate and interact, helping optimize layouts and pathways.
- Advanced Analytics Metrics: Advanced Analytics Metrics involve in-depth analyses, including cohort analysis, predictive analytics, and attribution modeling. These metrics provide advanced insights for improving CRO strategies.
- Device and Channel Metrics: Device and Channel Metrics examine user behavior across devices (desktop, mobile, tablet) and channels (email, social media, search engines). They ensure a seamless user experience across websites.
- Retention and Post-conversion Metrics: Retention metrics assess how well a company keeps customers engaged post-conversion. Churn rate, repeat purchases, and customer satisfaction scores are essential for long-term growth.
- Testing and Experimentation Metrics: Testing and Experimentation Metrics evaluate the effectiveness of A/B testing, multivariate testing, and other CRO experiments. Lift, confidence levels, and statistical significance are vital here.
- User Feedback Metrics: User feedback metrics capture qualitative insights from surveys, reviews, and usability tests. They complement quantitative data by revealing user opinions and pain points.
1. Engagement Metrics
Engagement Metrics are critical indicators that measure how users interact with a website or application. The metrics focus on users’ actions during their visit, shedding light on the effectiveness of content, design, and user experience. It helps businesses gauge whether their digital assets capture user interest and encourage deeper interaction.
Engagement metrics are crucial as they provide valuable insights into user behavior and preferences. Businesses identify areas of friction or disinterest by understanding how users navigate a site. High engagement correlates with better customer retention, improved conversion rates, and a stronger digital presence. For example, it indicates interest and satisfaction with the content or functionality if users spend significant time on a page or frequently click through multiple site sections.
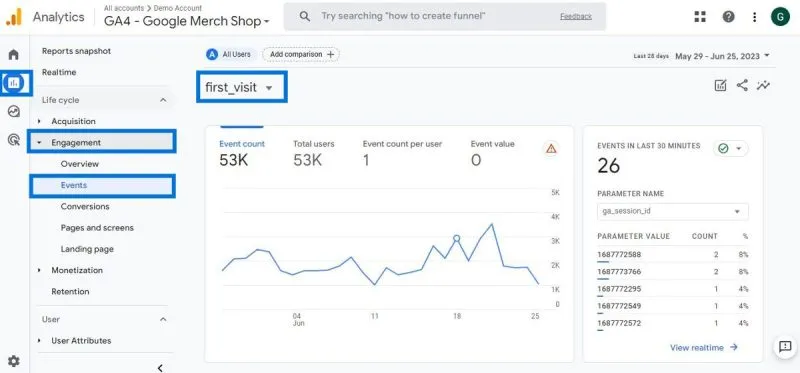
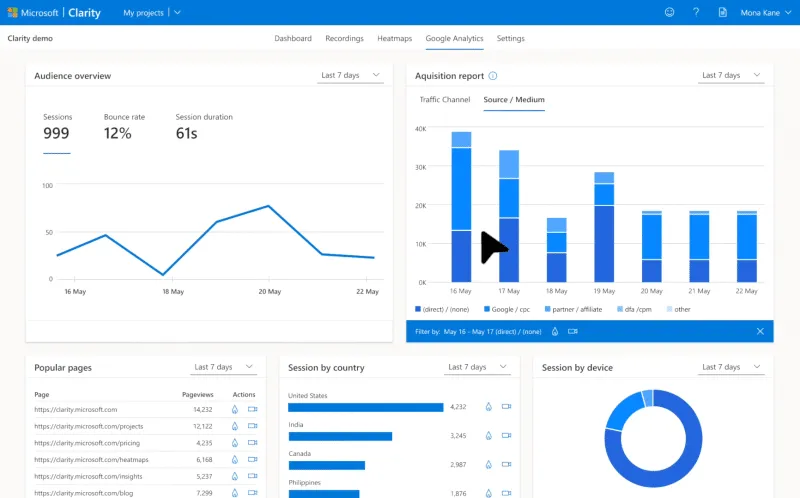
Engagement metrics are measured using Google Analytics, heatmaps, and session recordings. Metrics such as bounce rate (the percentage of visitors who leave a site after viewing only one page), average time on page, and pages per session offer valuable quantitative insights. Advanced tools track click-through rates on specific buttons or links, video play rates, and scroll depth to analyze user engagement in granular detail.
The category of CRO metrics is used across industries. Content-heavy websites, such as blogs, news websites, and educational portals, prioritize engagement metrics to ensure their audience finds value in their offerings. E-commerce websites rely on these metrics to assess how users interact with product pages, filters, and search functionality. Software as a Service (SaaS) companies track user engagement to optimize onboarding processes or feature discovery.
For example, an online retailer uses engagement metrics to determine whether customers are actively browsing product pages or abandoning their sessions after viewing the homepage. A high bounce rate indicates poor navigation or irrelevant content, requiring a redesign or better product categorization. A media company tracks video play rates and watch time to assess the success of its multimedia content strategy.
Businesses fine-tune their digital strategies by paying attention to engagement metrics, ensuring their website or application attracts and retains users, leading to conversions.
2. Conversion Metrics
Conversion Metrics are key indicators that measure the effectiveness of a website or application in driving users to complete desired actions. Conversion Metrics include purchasing, submitting a form, signing up for a newsletter, or any activity that aligns with business goals. It quantifies the success of strategies aimed at increasing user actions that lead to revenue or other business outcomes.
Conversion metrics are important because they directly relate to the core objectives of most businesses. These metrics provide insights into the performance of sales funnels, user journey optimization, and marketing effectiveness. High conversion rates indicate that users are successfully progressing through predefined paths, validating the effectiveness of the website or campaign in meeting business objectives.
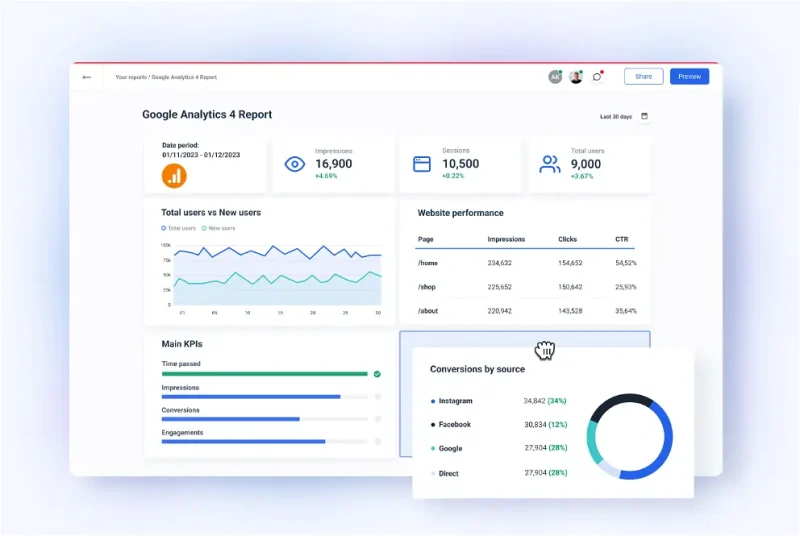
Conversion rate, click-through rate, and cost per conversion are measured using tools such as Google Analytics, marketing websites, or CRM systems. The conversion rate is calculated by dividing the number of successful actions by the total number of visitors or leads and expressing it as a percentage. The click-through rate evaluates the ratio of users who click on a link or advertisement to users who view it. Cost per conversion measures the expenditure required to acquire one conversion.
Businesses across various sectors use conversion metrics to track performance. E-commerce companies rely heavily on these metrics to measure sales and cart completions. SaaS businesses monitor free trial sign-ups and subscription conversions to evaluate the effectiveness of their marketing efforts. Service-oriented companies use these metrics to assess lead generation and appointment bookings.
For example, an online retailer measuring its conversion rate tracks the percentage of visitors who complete a purchase after viewing a product page. It indicates issues with pricing, unclear call-to-actions, or a complex checkout process if the conversion rate is low. A SaaS provider evaluates the success of a free trial campaign by analyzing how many users transition from the trial period to a paid subscription.
3. Revenue Metrics
Revenue Metrics are performance indicators that measure the monetary outcomes generated by a website, application, or digital marketing efforts. Revenue Metrics assess the financial impact of user interactions and provide insight into the profitability of a business’s online presence. It focuses on key data points such as total revenue, average order value, revenue per visitor, and customer lifetime value.
Revenue metrics are important because they directly reflect the success of a business’s strategies in achieving financial growth. These metrics help identify the most profitable customer segments, assess the effectiveness of pricing strategies, and evaluate the return on investment for marketing efforts. Monitoring revenue metrics allows businesses to make informed decisions to increase profitability and optimize resource allocation.
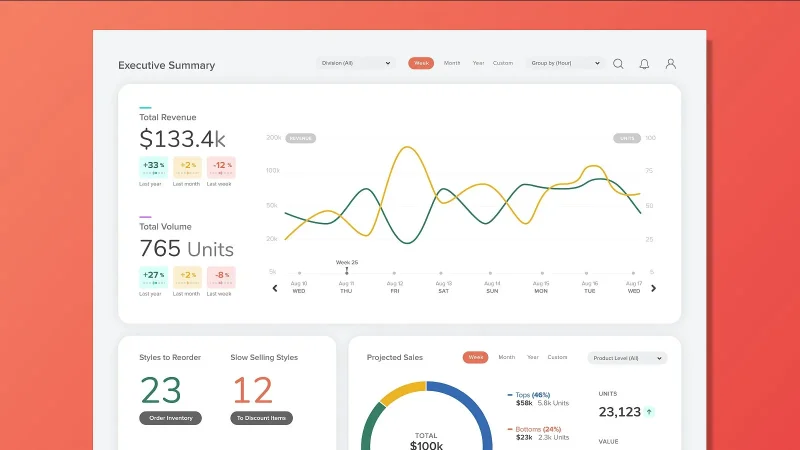
Revenue Metrics are measured using analytics websites, customer relationship management (CRM) systems, and e-commerce websites. Average order value is calculated by dividing total revenue by the number of orders. Revenue per visitor is determined by dividing total revenue by the number of website visitors. Customer lifetime value involves analyzing the revenue a customer generates over their entire relationship with the business.
Revenue metrics are used by various industries, including e-commerce, Software as a Service (SaaS), hospitality, and subscription-based services. E-commerce companies analyze revenue metrics to evaluate sales performance and optimize marketing campaigns. SaaS businesses track subscription revenue and upselling opportunities to maximize long-term profitability. The hospitality industry uses these metrics to measure the effectiveness of promotions and occupancy rates, while subscription services focus on recurring revenue trends.
For example, an online retailer tracking average order value identifies that customers purchasing bundled products tend to spend more. The insight leads to a strategic focus on promoting bundle deals. A SaaS company evaluating customer lifetime value discovers that users subscribing to annual plans generate more revenue than monthly plans, prompting an emphasis on promoting long-term subscriptions. Revenue metrics provide actionable insights for businesses to enhance financial performance and achieve sustainable growth.
4. Acquisition Metrics
Acquisition Metrics are performance indicators that measure the effectiveness of strategies in attracting new users, visitors, or customers to a website or website. Acquisition Metrics evaluate how well a business generates traffic, engages potential customers, and converts them into leads or paying clients. It focuses on identifying the sources and costs of acquiring new users and is essential for understanding the efficiency of marketing and advertising efforts.
The importance of acquisition metrics lies in their ability to highlight the channels and strategies that drive the most valuable traffic. These metrics help businesses optimize their marketing budgets, identify high-performing campaigns, and refine their targeting efforts. Effective monitoring of acquisition metrics ensures sustainable growth by providing insights into how users discover and engage with a business.
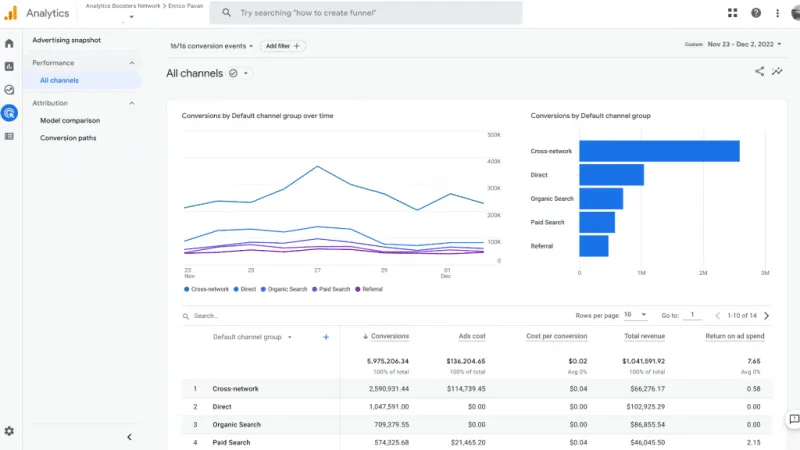
Acquisition metrics are measured using tools like Google Analytics, social media websites, and advertising dashboards. Common metrics include cost per acquisition, traffic sources, click-through rate, and organic versus paid traffic. Cost per acquisition calculates the average cost of acquiring one new customer by dividing the total campaign expenditure by the number of conversions. Traffic sources analyze the origins of website visits, such as search engines, social media, or email campaigns.
Businesses across industries use acquisition metrics to optimize their marketing and advertising strategies. E-commerce companies rely on these metrics to drive website traffic and boost sales. SaaS businesses measure lead generation effectiveness and assess the performance of their free trial campaigns. Content-driven websites and blogs evaluate acquisition metrics to grow their readership and expand their audience base.
For example, an e-commerce business tracking cost per acquisition finds that social media ads generate a lower cost per customer than search engine ads. The insight prompts a reallocation of the budget to maximize ROI. A SaaS company analyzing traffic sources discovered that organic search generates more high-quality leads than paid campaigns, leading to an increased focus on search engine optimization. Acquisition metrics guide businesses in refining their outreach strategies to attract and convert valuable customers.
5. Behavioral Metrics
Behavioral Metrics are indicators that measure the actions and interactions of users on a website, application, or website. Behavioral Metrics analyze how users navigate, engage, and interact with various elements, such as pages, buttons, or features. It provides a detailed understanding of user preferences, motivations, and barriers, enabling businesses to optimize user experience and improve conversion pathways.
The importance of behavioral metrics lies in their ability to uncover patterns and trends in user behavior. These metrics help identify friction points, such as pages with high exit rates or users abandoning forms. Businesses refine their design, content, and functionality by analyzing user behavior to align with user expectations. Behavioral metrics are essential for creating intuitive interfaces and ensuring seamless user journeys that encourage conversions.
Behavioral metrics are measured using heatmaps, session recordings, and web analytics websites. Common metrics include bounce rate, exit rate, scroll depth, and click-through patterns. Heatmaps visualize user activity on a webpage, highlighting areas where users click or hover. Session recordings capture user interactions in real-time, allowing businesses to observe navigation paths and identify usability issues. Bounce rate measures the percentage of users who leave a website after viewing a single page, indicating a lack of engagement.
Behavioral metrics are valuable for businesses across industries that prioritize user experience and digital performance. E-commerce companies analyze behavioral metrics to improve product navigation and checkout processes. SaaS providers evaluate user behavior during onboarding to ensure new users effectively discover key features. Media and content-heavy websites use these metrics to optimize content placement and reader engagement.
For example, an e-commerce store monitoring heatmaps notices that users frequently click on non-interactive images, suggesting clearer visual cues are needed. A SaaS company analyzing session recordings observes users struggling to locate a particular feature, prompting the addition of tooltips or better navigation labels. Behavioral metrics provide actionable insights that drive design improvements and enhance user satisfaction, supporting higher conversion rates.
6. Advanced Analytics Metrics
Advanced Analytics Metrics are sophisticated performance indicators that provide in-depth insights into user behavior, trends, and patterns by applying complex data analysis techniques. Advanced Analytics Metrics go beyond surface-level measurements, employing tools such as cohort analysis, predictive modeling, and attribution analysis to uncover hidden relationships and forecast future behaviors. They are essential for a holistic understanding of a website’s performance and the effectiveness of marketing strategies.
Advanced analytics metrics are important because of their ability to inform long-term strategies and identify underlying factors affecting conversions and user engagement. Businesses uncover growth opportunities, optimize resource allocation, and make informed decisions based on data-driven predictions by leveraging these metrics. They help organizations move from reactive adjustments to proactive optimizations, driving sustainable performance improvements.
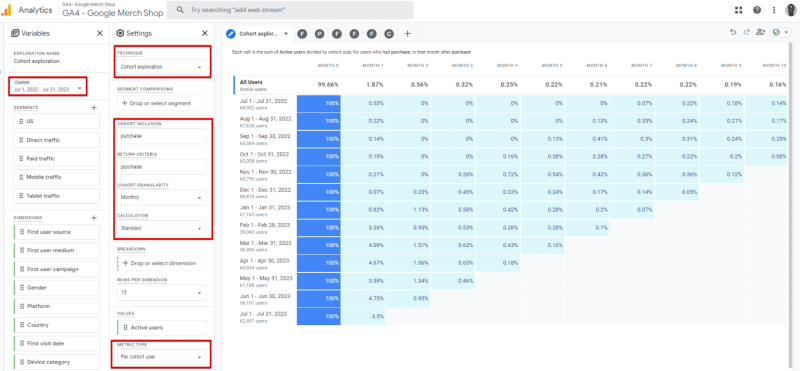
Advanced analytics metrics are measured using business intelligence software, advanced data websites, and machine learning algorithms. Examples include cohort analysis, which tracks user behavior over specific timeframes to identify retention trends; predictive analytics, which uses historical data to forecast future outcomes; and multi-touch attribution, which determines the contribution of each marketing channel to a conversion. These metrics require robust data collection and processing capabilities.
Businesses across industries that rely on large-scale data and complex customer interactions benefit from advanced analytics metrics. E-commerce companies use these metrics to predict future purchase behaviors and evaluate the effectiveness of marketing channels. SaaS providers apply predictive modeling to estimate user churn and optimize retention strategies. Financial services and healthcare industries utilize advanced analytics to assess risk, personalize offerings, and ensure compliance.
For example, an e-commerce retailer using predictive analytics identifies a group of customers likely to make repeat purchases and creates targeted loyalty programs. A SaaS provider applying cohort analysis discovered that users who engage with a specific feature during onboarding have higher retention rates, prompting changes to the onboarding process. Advanced analytics metrics enable businesses to uncover deeper insights, refine their strategies, and achieve long-term growth through precise data interpretation
7. Device and Channel Metrics
Device and Channel Metrics measure user interactions across devices (desktop, mobile, tablet) and channels (organic search, paid ads, social media, email). Device and Channel Metrics help businesses understand how users access and engage with their digital websites based on their technology and channels. Businesses optimize their digital presence for various devices and channels to improve user experiences and drive conversions by analyzing these metrics.
The importance of device and channel metrics lies in their ability to reveal user preferences and behavioral differences based on access points. Understanding which devices and channels perform best allows businesses to allocate resources effectively, tailor their content, and ensure a seamless user experience. These metrics are critical for identifying technical or design issues that hinder engagement and conversions with the increasing diversity in user technology.
Device and channel metrics are measured using analytics tools such as Google Analytics, marketing websites, and CRM systems. Device breakdown, channel traffic share, conversion rates by device, and engagement levels per channel provide insights into how users interact with a website. For instance, device metrics track the number of visitors accessing a site from mobile versus desktop, while channel metrics analyze traffic sources such as organic search, referral links, or email campaigns.
Businesses across all industries use device and channel metrics to optimize user experiences and marketing strategies. E-commerce websites track these metrics to ensure mobile responsiveness and assess which channels generate the highest sales. SaaS providers use them to evaluate the effectiveness of marketing campaigns across paid ads and organic searches. Media companies monitor device and channel performance to enhance content delivery and audience engagement.
For example, an e-commerce company analyzing device metrics found that mobile users have lower conversion rates than desktop users, indicating potential issues with mobile site design. The business boosts mobile conversions by addressing mobile-specific challenges, such as improving page load times or simplifying navigation. A SaaS provider evaluating channel metrics discovered that email campaigns drive higher trial sign-ups than social media ads, prompting a greater focus on email marketing strategies. Device and channel metrics enable businesses to adapt to user preferences and ensure optimal performance across all access points.
8. Retention and Post-conversion Metrics
Retention and Post-conversion Metrics are performance indicators that measure how effectively a business retains customers and maintains engagement after an initial conversion. Retention and Post-conversion Metrics evaluate customer loyalty, repeat behavior, and long-term value, focusing on repeat purchases, subscription renewals, and customer satisfaction. They provide insights into how well a business sustains customer relationships beyond the first interaction.
Retention and post-conversion metrics are crucial because retaining existing customers is more cost-effective than acquiring new ones. These metrics help businesses understand the factors influencing customer loyalty and identify opportunities to enhance lifetime value. High retention rates and positive post-conversion engagement indicate strong customer satisfaction, efficient service delivery, and a well-aligned value proposition, all contributing to sustainable growth.
Retention and Post-conversion Metrics are measured through tools like customer relationship management (CRM) software, subscription websites, and analytics dashboards. Common examples include churn rate, which measures the percentage of customers who stop engaging with a business over a specific period. Customer lifetime value estimates the total revenue a customer generates during their relationship with the business, and the net promoter score, which gauges customer loyalty and satisfaction through feedback surveys.
Businesses across various industries rely on retention and post-conversion metrics to sustain growth and enhance profitability. E-commerce companies use these metrics to track repeat purchases and loyalty program effectiveness. SaaS providers monitor subscription renewal rates and feature usage to identify churn risks and drive engagement. Service-based businesses measure satisfaction scores and repeat bookings to assess client loyalty and improve service quality.
For example, an e-commerce retailer tracking repeat purchase rates discovers that customers who participate in a loyalty program make more frequent purchases. The insight enhances the program with additional benefits to drive retention further. A SaaS company analyzing churn rates noticed a higher churn among users who fail to complete the onboarding process, prompting improvements in user training and support materials. Retention and post-conversion metrics enable businesses to build stronger relationships, improve customer satisfaction, and maximize long-term profitability.
9. Testing and Experimentation Metrics

Testing and Experimentation Metrics are performance indicators used to evaluate the effectiveness of various changes or strategies implemented on a website or application. Testing and Experimentation Metrics are associated with A/B testing, multivariate testing, and other experimental approaches designed to optimize user experience and improve conversion rates. They measure how well different versions or elements perform compared to a control, helping businesses make informed decisions based on empirical evidence.
Testing and experimentation metrics are essential in minimizing guesswork and ensuring that data, rather than assumption,s drive changes. Businesses identify what resonates most with users by experimenting with variations in design, content, calls to action, or functionality. The approach reduces risks, maximizes the impact of optimizations, and fosters continuous improvement in conversion rate optimization efforts.
Testing and Experimentation Metrics are measured using specialized tools like Omiconvert Explore, Adobe Target, and analytics websites. Common examples include conversion lift, which quantifies the improvement in conversion rates due to an experiment, and statistical significance, which ensures that results are reliable and not due to random chance. User engagement metrics specific to the tested elements, such as click-through rates on buttons or forms. Measurement involves careful experimental design, proper segmentation, and consistent tracking of relevant data points.
Testing and experimentation metrics are used by various businesses that aim to optimize their digital presence. E-commerce websites conduct experiments to improve product page layouts, pricing strategies, and checkout processes. SaaS providers test onboarding flows and feature placements to enhance user adoption. Media companies test content recommendations and ad placements to boost reader engagement and revenue.
For example, an e-commerce company runs an A/B test comparing two different versions of a product page, one with user-generated reviews prominently displayed and another focusing on product specifications. A business confidently implements the design with reviews across the site if that version significantly lifts conversions. A SaaS provider testing two onboarding flows found that a guided tutorial leads to higher feature adoption rates than a self-service option, prompting a shift in onboarding strategy. Testing and experimentation metrics empower businesses to refine their websites and strategies based on real-world user behavior and data-driven insights.
10. User Feedback Metrics

User Feedback Metrics are qualitative performance indicators that capture insights directly from users regarding their experiences, preferences, and challenges with a website or application. User Feedback Metrics provides a deeper understanding of user perspectives by collecting information through surveys, reviews, usability tests, and other feedback mechanisms. They complement quantitative data by adding the human context needed to refine user experience and address specific pain points.
The importance of user feedback metrics lies in their ability to uncover issues that analytics alone do not detect. These metrics help identify hidden obstacles, clarify user intentions, and provide actionable suggestions for improvement. Businesses that actively listen to user feedback are better equipped to enhance customer satisfaction, reduce friction in the user journey, and increase loyalty. Direct feedback ensures that changes align with actual user needs rather than assumptions.
User feedback metrics are measured through tools like online surveys, customer feedback websites, live chat transcripts, and app store reviews. Examples include net promoter score, which measures user willingness to recommend a product; satisfaction scores from post-interaction surveys; and qualitative insights from open-ended feedback. Usability tests provide observational data by monitoring how users interact with specific features and identifying areas of confusion or frustration.
Various industries, like e-commerce, use User Feedback Metrics to improve user experience and align offerings with customer expectations. E-commerce websites gather feedback to address issues in product selection, checkout processes, or delivery experiences. SaaS companies use these metrics to evaluate user perceptions of software features, ease of use, and satisfaction. Service-based businesses rely on feedback to refine customer service and operational efficiency.
For example, an e-commerce company uses post-purchase surveys to ask customers about their checkout experience. Businesses simplify and clarify the payment process if users are confused about payment options. A SaaS provider uses usability tests to observe how new users interact with a complex feature, leading to improvements in design or onboarding materials. User feedback metrics provide a crucial channel for understanding the customer perspective, enabling businesses to make targeted, user-centric improvements that enhance performance and satisfaction.
What are CRO Metrics?
CRO Metrics are measurable indicators used to evaluate the performance and effectiveness of conversion rate optimization strategies. CRO metrics track user behavior, engagement, and outcomes on a website or application to assess how successfully users complete specific actions such as making purchases, signing up, or submitting forms. The metrics provide data-driven insights to identify areas for improvement and guide decision-making to enhance user experience and achieve business goals.
CRO metrics aim to analyze and optimize users’ steps toward conversions. These metrics help businesses understand the effectiveness of their digital websites, marketing campaigns, and user journeys. Organizations identify obstacles in the conversion process, test potential solutions, and implement data-backed strategies to improve performance by monitoring CRO metrics. The goal is to maximize the value derived from existing traffic and resources without the need for additional acquisition efforts.
CRO metrics are important because they directly contribute to the growth and profitability of a business. These metrics enable organizations to make informed decisions based on user data, reducing reliance on assumptions. Monitoring CRO metrics helps improve key performance indicators such as conversion rates, customer retention, and revenue. They clarify user preferences and behavior, allowing businesses to tailor their strategies for better alignment with customer expectations.
For example, tracking metrics like bounce rate, average order value, and cost per acquisition enables businesses to refine their website design, optimize pricing strategies, and enhance marketing efforts. CRO metrics create opportunities for businesses to achieve higher returns on investment and build stronger connections with their audience. Understanding and leveraging CRO metrics is essential for achieving sustainable growth and maintaining a competitive edge in the digital landscape.
What is the Use of CRO Metrics?
The use of CRO Metrics provides measurable insights that help businesses evaluate and optimize the performance of their digital websites. CRO metrics allow organizations to assess the effectiveness of their marketing campaigns, website design, and user journeys. Businesses make informed decisions to enhance their online presence and achieve their objectives efficiently by analyzing specific data points.
The key use of CRO metrics is in evaluating performance. Metrics like conversion rates, bounce rates, and average time on page help assess how well a website or application meets its intended goals. They provide a clear picture of which strategies are working and which need adjustment, enabling businesses to refine their processes and maximize results continuously.
Another essential use is improving conversion rates. CRO metrics track user actions that lead to conversions, such as form submissions, purchases, or sign-ups. Businesses implement targeted optimizations that increase the likelihood of users completing desired actions, resulting in higher ROI from existing traffic and resources by identifying patterns and trends.
CRO metrics are valuable for understanding user behavior. They reveal how users interact with a website, including navigation patterns, engagement levels, and click-through rates. The information helps businesses align their offerings with user preferences and expectations, enhancing the user experience and building customer satisfaction.
A critical use of CRO metrics is identifying issues and bottlenecks in the conversion process. Metrics like exit rates, session recordings, and heatmaps highlight where users face friction or drop-off. These insights allow businesses to pinpoint problems, such as confusing navigation, slow loading times, or ineffective calls-to-action, and address them effectively.
The comprehensive use of CRO metrics empowers businesses to create data-driven strategies, streamline user experiences, and drive sustainable growth. Organizations stay competitive and responsive to the evolving needs of their users by continuously monitoring and optimizing these metrics.
When Should CRO Metrics be Used?
CRO (Conversion Rate Optimization) metrics should be used when businesses seek to improve user experience, increase conversions, or identify inefficiencies in the digital customer journey. CRO metrics are essential for organizations aiming to maximize the value of their online presence by optimizing existing traffic and resources. CRO metrics help businesses refine their strategies to achieve better outcomes by focusing on data-driven insights.
CRO metrics must be used when evaluating the performance of a website or application. Tracking metrics such as conversion, bounce, and click-through rates allows businesses to measure how effectively their digital websites meet user expectations and business goals. The evaluation is crucial during declining performance or launching new campaigns, products, or features.
CRO metrics are essential during the testing and experimentation phases. A/B testing, multivariate testing, and other optimization experiments rely on these metrics to measure the impact of changes. Metrics such as lift, statistical significance, and user engagement levels provide evidence to determine whether adjustments improve the desired outcomes. It is critical when introducing new designs, content, or functionalities.
CRO metrics must be applied when analyzing customer behavior and preferences. Metrics like session duration, scroll depth, and heatmaps help businesses understand how users interact with their websites. The insight is valuable when creating personalized user experiences, optimizing landing pages, or tailoring content strategies to align with user expectations.
CRO metrics are necessary when addressing issues or bottlenecks in the customer journey. High exit rates, low engagement, or cart abandonment indicate problems that need resolution. These metrics enable businesses to pinpoint where users encounter friction, such as during the checkout process, navigation, or content consumption, and implement targeted solutions to remove barriers.
Using CRO metrics is essential when businesses aim to achieve sustainable growth, enhance ROI, and remain competitive in the digital marketplace. Organizations build a more efficient, user-friendly, and conversion-driven online presence by consistently monitoring and acting on these metrics.
How to Decide Which CRO Metrics Should be Used?

To decide which CRO Metrics should be used, there are four steps to follow. First, define business goals and objectives. Choosing the right CRO (Conversion Rate Optimization) metrics depends on specific business goals, the user journey, and the website being optimized. Goals such as increasing purchases, improving sign-up rates, or reducing bounce rates determine the most relevant metrics. For example, an e-commerce website focusing on sales prioritizes metrics like conversion rate and average order value, while a SaaS company tracking user adoption focuses on free trial sign-ups and feature usage.
Second, analyze the user journey to identify critical stages where optimization is needed. Mapping the user journey helps pinpoint landing pages, product pages, or checkout processes that impact conversions. Behavioral metrics like bounce rate, exit rate, and session duration become essential for understanding how users interact with these stages. For instance, a high exit rate during the checkout process signals a need to measure and address cart abandonment.
Third, align metrics with audience behavior and website specifics. Different websites, such as mobile applications, websites, or multi-channel systems, require tailored metrics. Businesses targeting mobile users prioritize mobile-specific metrics such as load time and conversion rate by device. Companies analyzing traffic sources focus on channel performance metrics, including cost per acquisition and click-through rates.
Lastly, ensure metrics align with the desired outcomes and provide actionable insights. Metrics must directly reflect progress toward key goals, allowing businesses to make data-driven decisions. For instance, improving customer retention requires monitoring metrics like churn rate, repeat purchase rates, or customer lifetime value. Testing and experimentation metrics, such as conversion lift and statistical significance, are essential when running optimization experiments to achieve measurable results.
The decision involves aligning metrics with objectives, audience behavior, and the desired outcomes. Businesses effectively select metrics that deliver meaningful insights, support targeted optimizations, and drive measurable improvements in conversion performance by following these steps.
What Industries use the Following CRO Metrics Categories?
The industries that use the following CRO Metrics categories are diverse and rely on data-driven insights to optimize performance, user experience, and conversions. Each category of CRO metrics serves specific purposes, making them relevant to various industries depending on their goals, websites, and customer interactions.
Engagement Metrics are used by content-driven industries such as media, publishing, and educational websites. These industries monitor user engagement through metrics like bounce rate, time on page, and scroll depth to understand how well content resonates with their audience. For example, news websites track pages per session to evaluate reader interest and improve content delivery strategies.
Conversion Metrics are utilized by e-commerce, SaaS, and service-based industries. E-commerce websites measure conversion rates to assess product purchases, while SaaS companies track sign-ups and subscription completions. Service providers such as healthcare or financial institutions use these metrics to evaluate form submissions, appointment bookings, or service inquiries.
Revenue Metrics are essential for industries focused on financial outcomes, such as e-commerce, SaaS, and subscription-based services. Online retailers analyze metrics like average order value and revenue per visitor to optimize product pricing and promotions. SaaS providers focus on customer lifetime value and recurring revenue to ensure long-term profitability. Subscription websites measure churn rates and renewal rates to sustain revenue growth.
Acquisition Metrics are extensively used by industries relying on traffic generation and lead acquisition, including digital marketing, e-commerce, and real estate. Metrics like cost per acquisition and traffic sources help businesses evaluate the performance of paid ads, SEO, and referral campaigns. For instance, real estate companies measure lead generation effectiveness from paid campaigns to drive inquiries.
Behavioral Metrics are valuable for industries focused on user experience optimization, such as SaaS, e-commerce, and gaming. SaaS companies use behavioral insights to improve onboarding processes, while e-commerce websites track heatmaps and session recordings to streamline navigation and checkout experiences. Gaming companies evaluate in-app behavior to enhance gameplay and engagement.
Data-intensive industries such as finance, healthcare, and enterprise SaaS use Advanced Analytics Metrics. These industries rely on predictive analytics, cohort analysis, and attribution modeling to forecast trends, assess risks, and optimize customer interactions. For example, financial institutions use predictive metrics to estimate loan risks and customer profitability.
Device and Channel Metrics are crucial for industries with multi-website engagement, including retail, travel, and media. Retail businesses measure mobile, desktop, and tablet conversion rates to ensure seamless shopping experiences. Media websites analyze channel performance, such as organic search and social referrals, to drive audience growth and engagement.
Subscription-based services, SaaS, and e-commerce businesses use Retention and Post-conversion Metrics. SaaS companies measure churn rates and feature usage to ensure long-term user retention. E-commerce websites track repeat purchase rates and loyalty program effectiveness to sustain customer engagement. Subscription services analyze renewal rates to maximize lifetime value.
Testing and Experimentation Metrics are essential for industries implementing continuous optimization, such as e-commerce, SaaS, and digital marketing. Online retailers run A/B tests to optimize product pages and pricing strategies, while SaaS companies test feature placements to improve user adoption. Digital marketing agencies use experimentation metrics to refine ad creatives and landing pages.
User Feedback Metrics are used by industries prioritizing customer satisfaction and experience, including hospitality, healthcare, and e-commerce. Hospitality businesses collect feedback through surveys to improve guest experiences, while healthcare providers use feedback to enhance service delivery. E-commerce companies rely on customer reviews and ratings to address product concerns and refine offerings.
CRO Metrics categories span industries that aim to optimize user journeys, improve conversions, and maximize long-term value. Each industry tailors the relevant CRO metrics to align with its business goals, ensuring continuous growth and customer satisfaction.
What is the Difference Between CRO Metrics and CRO Tools?
The difference between CRO Metrics and CRO Tools lies in their roles and functions in Conversion Rate Optimization (CRO). CRO Tools are the technologies or websites used to collect, analyze, and optimize metrics to improve conversions, while CRO metrics measure performance and outcomes.
CRO Metrics are measurable indicators that evaluate the success of a website, application, or marketing campaign in driving user actions. These metrics include conversion rate, bounce rate, click-through rate, and average order value. They serve as key benchmarks to monitor user behavior, identify bottlenecks, and assess the effectiveness of optimization efforts. Businesses use these metrics to set goals, make data-driven decisions, and track progress.
CRO Tools are software solutions or websites that help businesses collect data, analyze metrics, and implement optimization strategies. These tools provide the infrastructure to measure CRO metrics and test changes effectively. Examples of CRO tools include Google Analytics for performance tracking, Optimizely for A/B testing, and Hotjar for heatmaps and session recordings. Gathering and analyzing CRO metrics is time-consuming and inaccurate without CRO tools.
The primary difference is that CRO metrics are what businesses measure, while CRO tools are how businesses measure and act on metrics. Metrics provide insights into what is working and what needs improvement, while tools enable the collection, visualization, and testing of insights. For example, a bounce rate (a CRO metric) shows the percentage of visitors leaving a page, while a CRO tool like Hotjar visualizes user interactions to pinpoint the cause of the high bounce rate.
CRO metrics act as performance benchmarks, whereas CRO tools act as facilitators for optimization. Metrics identify problems, but tools offer solutions by supporting activities like testing variations, tracking user sessions, and analyzing heatmaps. CRO Tools and Metrics are interconnected and essential for successful conversion rate optimization.
CRO metrics quantify the outcomes of optimization efforts, while CRO Tools provide the necessary capabilities to collect and analyze data. Businesses rely on tools to gather and interpret the data needed to improve the metrics, ensuring an efficient and results-driven CRO process.