


Imagine this: you’ve spent weeks meticulously setting up A/B tests. You’ve crafted multiple variants, aligned your team, and even run detailed analysis. The anticipation builds as you collect data, and you become confident that the insights will unlock the key to higher conversions. But when the results roll in…something’s off. The numbers don’t add up, the differences are wildly inconsistent, and worse, you realize that the entire test might be flawed. All that effort, time, and resources – wasted.
It’s like spending hours perfecting a dish, only to realize the oven was broken the whole time.
You weren’t cooking at all – you were just waiting for nothing to happen.
The frustration hits hard because it wasn’t your recipe that failed, but the basic setup. Maybe you should have tested the oven.
That’s exactly the kind of disaster A/A testing helps you avoid.
A/A testing ensures your setup is ready before experimenting, so future tests yield meaningful insights.
In other words, A/A testing ensures that you’re ready for cooking before you pour your energy into optimizing for results.
Why A/A Testing is Your Secret Weapon for Accurate CRO
You’ve likely heard the saying, “You can’t manage what you don’t measure.”
That’s especially true in the world of analytics and conversion rate optimization. When you’re trying to improve your website’s performance or improve your app’s user experience, A/B testing is the go-to solution.
But, before diving into A/B or multivariate tests, how do you ensure that your testing environment is set up correctly?
That’s where A/A testing comes into play, as the unsung hero of the testing world.
Think of it like a dress rehearsal before the big performance – getting the stage ready so when the real test happens, everything runs smoothly.
Why A/A Testing is the Secret Sauce for Nailing Your A/B Split Test
By showing two identical versions of your page, email, or experience to your audience, you aren’t testing for differences in performance; you’re testing the reliability of your testing environment. Both versions should perform identically, confirming that your tracking, audience segmentation, and data collection systems are functioning correctly.
If the data coming from both versions doesn’t align, tada – you’ve uncovered issues early; the issues that could otherwise render your A/B tests meaningless.
So, A/A testing essentially acts as a quality check before diving into more complex tests. It prevents headaches later on by catching technical problems early on, like faulty tracking pixels, skewed audience distribution, or issues in your testing tool. It is like a health checkup for your testing tools.
A/A testing validates that:
- The data you’re collecting is accurate
- The audience is being split correctly
- Your tracking metrics are trustworthy.
If an A/A test shows a significant difference between two identical versions, you know there’s an issue that needs fixing before running actual tests.
A/A Testing vs. A/B Testing: Why A/A Always Comes First
A/A & A/B testing should never be confused with one another. As the name suggests – in the dictionary of professional CRO consultants, A/A always comes before A/B. Let’s double-click on this for a moment to ensure a crystal-clear understanding of the difference between the two:
- In A/B testing, you’re comparing two different versions (like web page designs or ad creatives) to see which one performs better. The goal is simple: find out which version drives more conversions, clicks, or user actions and optimize based on that data. This is where you fine-tune your strategy to improve performance.
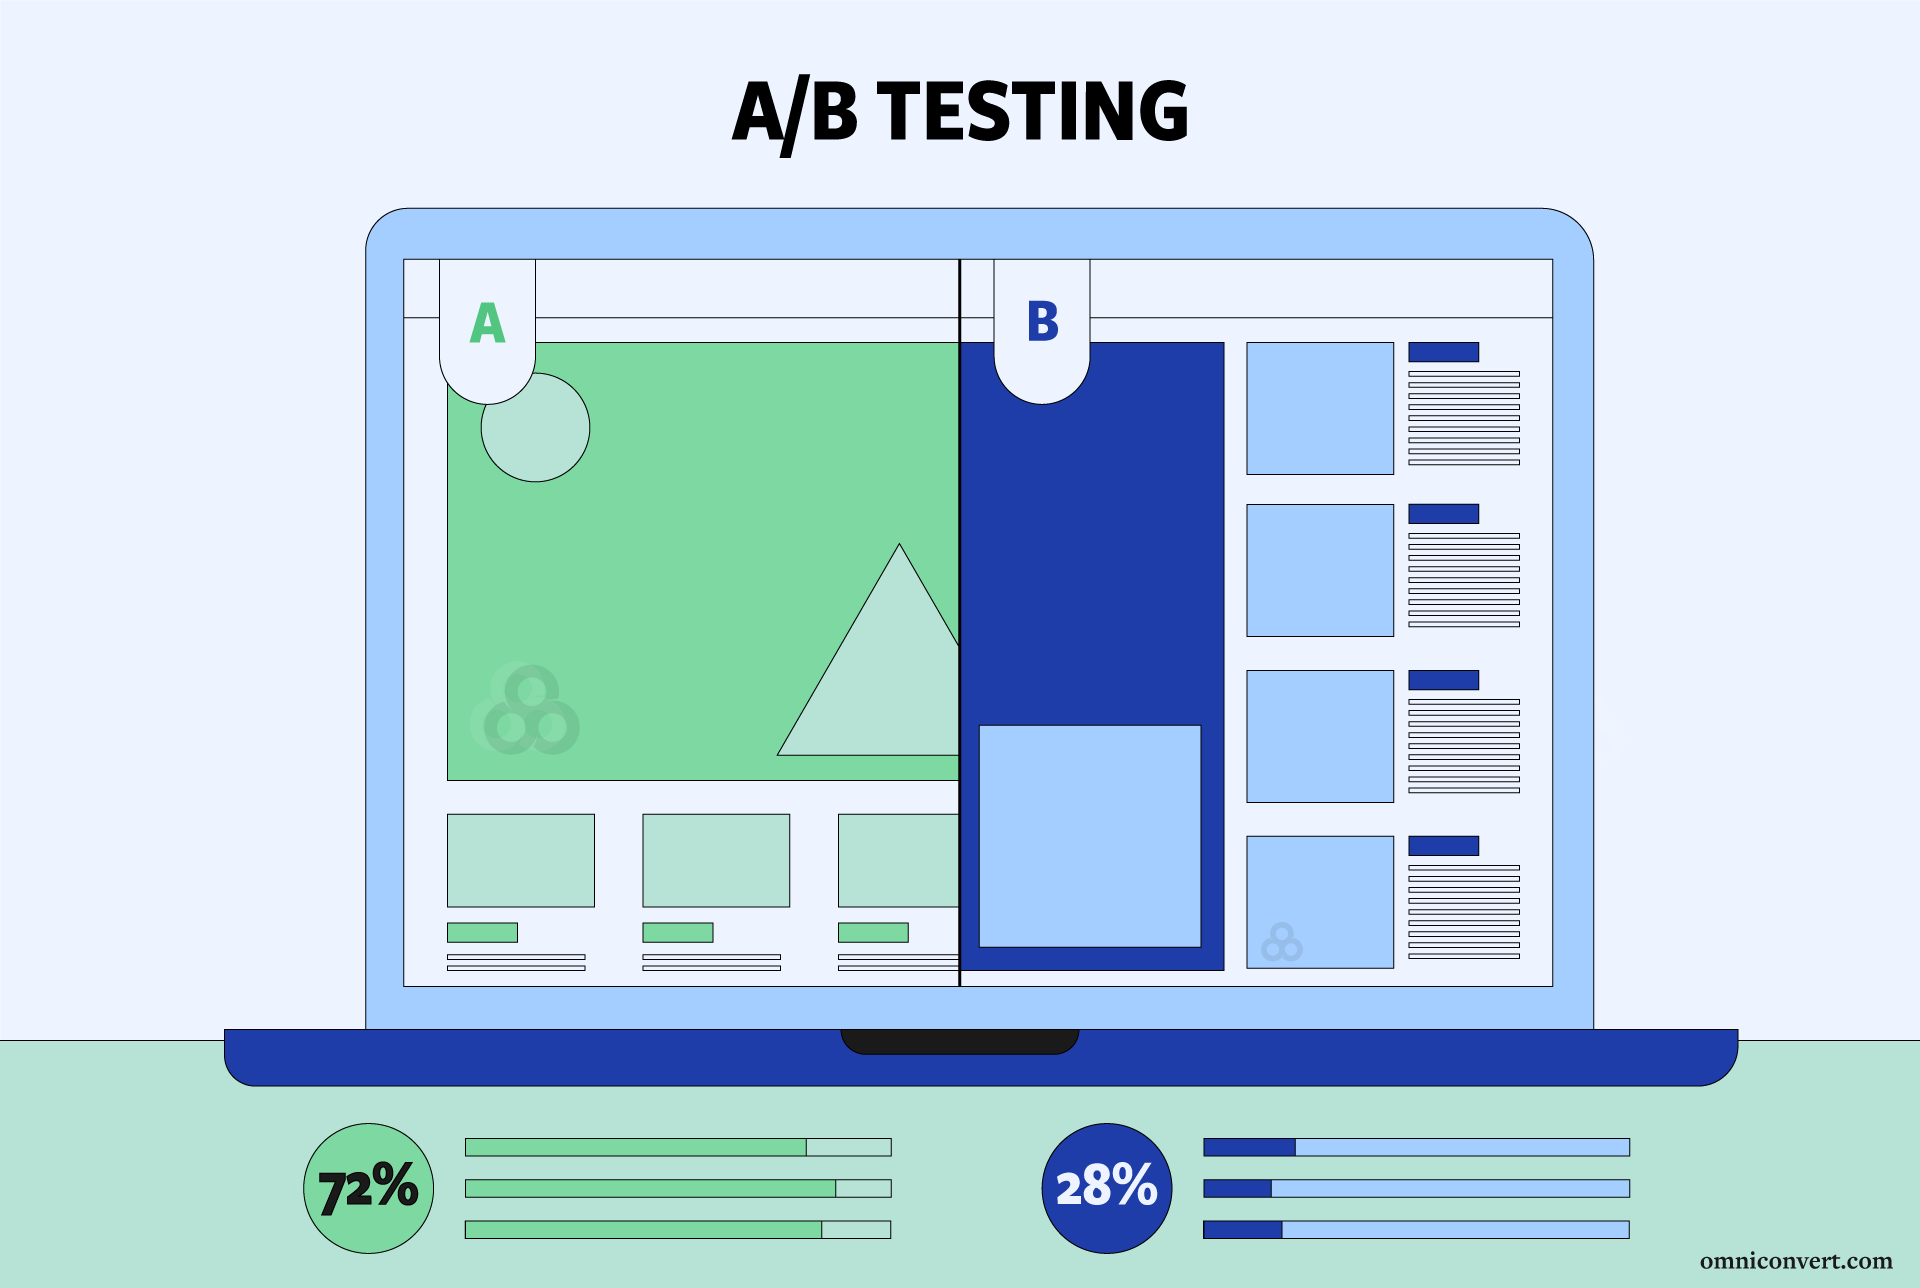
- In A/A testing has a completely different purpose. It’s about validating your testing environment and making sure everything is working as expected before you move on to actual A/B testing. In A/A testing, you’re comparing two identical versions (A vs. A). Unlike A/B testing, you’re not looking for a winner; you’re ensuring that the tools, randomization, and tracking are functioning correctly.
In other words, A/B testing shows you which version performs better, but A/A testing ensures you’re ready to test. Skipping this step can lead to misleading data, causing you to make decisions based on a flawed testing environment.
It applies across industries – whether in e-commerce, SaaS, or B2B by validating tracking, ensuring seamless user flows, and preventing costly mistakes.
It’s a non-negotiable step to ensure your data-driven decisions are accurate from the start.
How To Run A/A Testing Like a Pro
Now that we’ve covered what A/A testing is and why it’s so important, we’re ready to dive into the ‘how’ of A/A testing. But before we get into the step-by-step process, let’s first gather our ingredients.
Just like following a good recipe, having all the right things in place ensures that your A/A test is set up for success.
So, here’s what you’ll need to prepare for your very first A/A test.
Ingredients for Setting Up an A/A Test
Here is everything that you need to run your first A/A test:
- Two Identical Versions: Whether it’s a webpage, email, or ad, you’ll need two perfectly identical versions to compare.
- A Testing Platform: Ahem… shameless plug – an A/B testing platform like Omniconvert Explore to handle all your traffic splitting and data tracking needs.
- A Defined Audience: Ensure you have a clear audience to split equally for testing.
- Key Metrics to Track: Conversion rates, click-through rates, and engagement – just like in A/B testing.
- Sample Size: A large enough sample to guarantee statistical reliability.
- Time: Let the test run long enough to collect meaningful data, ideally at least a few business cycles or weeks depending on traffic volume.
Choosing the Right Platform 👉
Selecting the right testing platform is critical to the success of your A/A test. A reliable platform like Omniconvert ensures your audience is properly randomized, and all metrics are tracked accurately while running A/A or A/B split tests.
Great! You’ve gathered all the ingredients, now it’s time to start cooking.
Follow this step-by-step process to set up the perfect A/A tes to ensure that your data comes out piping hot and perfectly seasoned. Let’s get started.
Step 1: Create 100% Identical Versions
Like cooking with two identical ingredients, the first step is ensuring both versions (A and A) are 100% the same. Whether it’s a webpage, an ad, or an email campaign, there should be no differences.
Step 2: Split Your Audience
Randomly assign users into two groups. Think of it like dividing the guests at your dinner party – make sure they’re equally distributed to avoid any biases.
Step 3: Track Metrics
Just as you monitor the temperature while cooking, you’ll track key performance indicators (KPIs) like conversion rates, click-through rates, and engagement.
Step 4: Let the Test Simmer
Allow your A/A test to run long enough to gather enough data. Patience is key here – you want a large sample size to ensure reliable results.
Step 5: Check for Statistical Significance
Once your test has run its course, it’s time to analyze the results. Check if any differences in the data are purely due to random chance. If not, it’s like finding out the dish didn’t turn out as expected – you’ll need to fix the underlying issue before moving on.
As you might notice, designing an A/A test is straightforward, but attention to detail is key.
Always remember that you’re creating two perfectly identical setups, whether they’re landing pages, email campaigns, or other digital elements. The goal is to ensure everything in your testing environment is working properly before you begin A/B testing.
Any significant difference in performance between the two groups signals that something is wrong, and you need to troubleshoot your setup before proceeding.
Now you’ve got the process for a successful A/A test, it’s time to ensure we got everything right. Let’s go over the best practices for A/A testing.
Best Practices for Successful A/A Testing
To ensure your A/A tests are accurate and effective, it’s crucial to follow these best practices. Let’s dive into how to get the most out of your A/A tests.
1. Run the Test Long Enough to Gather Meaningful Data
Ensure your A/A test runs long enough to collect a sufficiently large sample size. Let the test span multiple business cycles, including peak and off-peak periods, to capture varied and reliable data.
2. Check for Randomness in Audience Split
Make sure your testing platform properly randomizes users across both groups to avoid bias. Verify that each group has balanced demographics and behavior patterns to ensure accurate results.
3. Use the Right Tools to Track and Measure Accurately
Choose robust tools like Microsoft Clarity or Omniconvert to track and measure key metrics without errors. Regularly audit your tracking setup to avoid data discrepancies and ensure consistent, reliable results.
When running A/A tests, the goal isn’t to find a winning version – it’s to ensure everything under the hood is working smoothly. You track similar metrics to A/B testing, but the focus here is on validating your setup, tools, and audience segmentation.
What Data Should You Collect in A/A Testing?
Here’s the key data you should evaluate after running A/A split tests:
- Conversion Rate: This is the bread and butter of any test. In A/A testing, both groups should show nearly identical conversion rates. If not, there could be issues with audience segmentation or tracking glitches. Spotting this early means you don’t end up chasing fake wins or false failures.
- Click-Through Rate (CTR): If you’re testing emails, ads, or buttons, track CTR (the percentage of people who click through). Identical versions should produce similar results – if they don’t, something’s off with your setup.
- Bounce Rate: Bounce rate tells you how many users visit one page and leave. In A/A testing, this rate should stay consistent across both groups. If there’s a noticeable difference, it could point to problems with randomization or page load times.
- Session Duration: How long users stick around matters, and both groups should show comparable session lengths. If one group spends more time on the site than the other, your tracking might not be working as expected.
- Page Views per Session: This metric helps you understand how many pages, on average, a user visits per session. Identical experiences should yield similar results – if not, it’s a sign something is off in your tracking or the way users are assigned to groups.
- Audience Segmentation and Distribution: Your audience needs to be split evenly between the two groups. Keep an eye on demographics, geography, and devices used. If one group has a different profile than the other, it’s a red flag that your testing platform isn’t randomizing correctly.
- Technical Performance Metrics: You’ll want to track things like page load speed and server response time. Differences between the two groups can reveal hidden technical issues, which could skew your results when you move to A/B testing.
- Error Rates and Bugs: If there are any bugs, they should show up consistently across both groups. If one version shows more errors than the other, there’s likely a setup issue or a bug in your testing tool.
- User Engagement: Whether it’s clicks, video plays, form submissions, or scroll depth, user interactions should look identical across both groups. Any major difference means there could be an issue with how your platform logs behavior.
- Drop-Off Points in Funnels: If you’re running an A/A test on a multi-step funnel (like a checkout process), both groups should show similar drop-off points. If one group bails sooner than the other, that’s a signal that something’s off with your funnel tracking.
Tracking these metrics gives you peace of mind that your testing environment is running smoothly.
Think of it like running a systems check before launching a rocket – you want to catch any issues early, not after you’ve gone live with A/B tests.
How to Analyze A/A Test Results
Now that your A/A test is up and running, you’ll start collecting valuable data. But how do you make sense of it all? This is where knowing how to analyze A/A test results becomes crucial. And to do that, you should understand key concepts related to data collection & analysis, false positives, and negatives.
Data Collection and Analysis
Once your A/A test has concluded, the first step is to collect and analyze the performance data. Since both groups are seeing identical versions, you should expect them to perform similarly. If the two groups show large discrepancies in key metrics – such as click-through rates, conversion rates, or engagement – it’s a signal that something went wrong. This could be due to an issue with your tracking tools, improper randomization of audience segments, or other external factors that impacted one group differently than the other. In this case, it’s time to dig deeper and troubleshoot the problem.
False Positives and Negatives
Even in A/A testing, it’s possible to encounter false positives (where it looks like there’s a difference between the groups when there isn’t) or false negatives (where you fail to see a real issue that exists).
These occur due to random chance, but luckily, they’re easier to detect in A/A testing because both versions are supposed to behave identically. If you notice a significant variation between the two groups, it’s a red flag that something’s off with your test setup, and you can investigate before running any A/B tests.
By thoroughly analyzing the results and understanding the potential pitfalls of false positives and negatives, you can ensure that your test environment is functioning properly before moving forward with more complex testing scenarios.
How do you ensure that the data from your A/A test is reliable? Well, just ensure a large enough sample size to draw meaningful conclusions.
Even though the versions are identical, small differences can still appear due to random variation. The goal is to ensure that these variations fall within a normal margin of error. By ensuring your sample size is sufficient, you can confidently detect whether any discrepancies are due to random chance or if there’s a deeper issue in your testing environment.
Conclusion
A/A testing lays the foundation for meaningful A/B tests, saving you from wasted time and flawed insights. By following the steps outlined in this guide, you can ensure that the experiment you run in the future gives you reliable data.
I hope this article has equipped you with the knowledge to set up and run better A/B tests by first ensuring your environment is flawless with A/A testing.
If you’re looking for a seamless way to handle both A/A (and of course A/B testing), try Omniconvert – a user-friendly CRO platform that makes tracking, measuring, and optimizing easier.
Happy testing! May your data always guide you toward your conversion goal.